The Impact of Sampling Density on Glacier Mass Balance Determination

Summary

How many measurements are necessary to accurately assess the mass balance of a glacier?

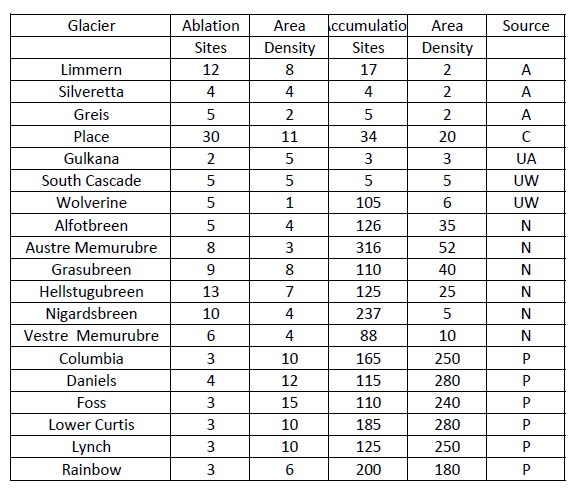
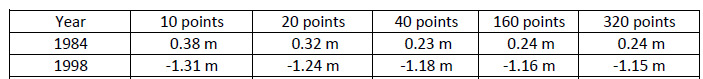
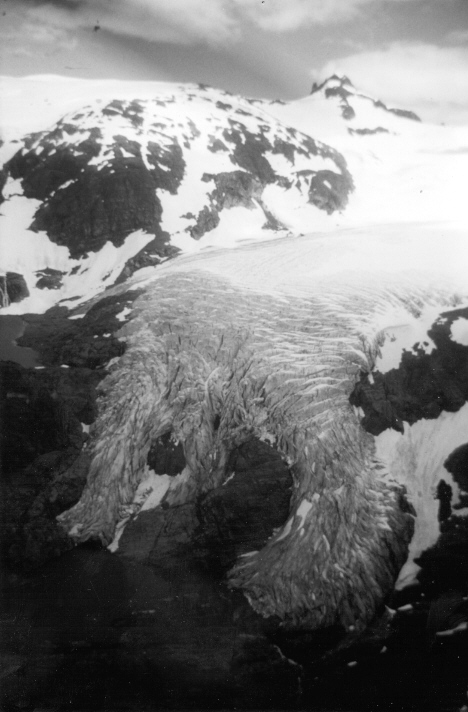
To identify the impact of sampling density on  determination of a glacier’s annual mass balance, the North Cascade Glacier Climate Project utilized a  varying density of measurements to determine annual mass balance on Columbia Glacier, Washington and Lemon Creek Glacier, Alaska.  Mass balance was determined solely from field measurements.  The density of the mass balance networks ranged from 1 to 375 points/km2.  The lesser density networks were sub-samples of the highest measurement density network.  The highest density network is probably the highest measurement density ever used in mass balance observations.  The point simply to see if an absurdly high density helped improve accuracy.  The results on both glaciers indicate significant improvement in accuracy resulting from increasing the total number of measurements from 1 to 4 points/km2 on Lemon Creek Glacier and 12 to 46 points/km2 on Columbia Glacier.   There was no significant improvement in accuracy on the smaller Columbia Glacier for utilizing more than 46 points/km2.  On Lemon Creek Glacier there was little improvement in mass balance assessment for a network greater than 4 points/km2.  On both glaciers this represented a network of 40 measurement sites.

The annual mass balance of a glacier is the most sensitive climatic measure of a glacier (IPCC, 1996). Annual mass balance is typically assessed from a sparse network (0.5-50 points/km) of sample locations that are not uniformly distributed across the glacier (Pelto, 1996; Fountain and Vecchia, 1999).  The main source of error in mass balance measurement programs arises from the non-representativeness of this sparse measurement network from which the whole glacier estimate is determined (Cogley, 1996; Paterson, 1994).

Table 2. The annual balance in meters of water equivalent determined from field measurements networks of varying number of measurement sites on Columbia Glacier. The fewer the number of measurements the more negative the annual balance calculated. Note the similarity in results of using 40 or 94 points and 169 or 338 points.

The Full Report which is published in Hydrologic Processes is below

Figure 1. The Columbia Glacier from the south end of Blanca Lake in 1992.

Introduction

Ideally, a mass balance measurement network is scattered uniformly over the entire glacier with a density of measurements sufficient for statistical testing of the results.  Logistically, measurements are only made at a limited number of points and some areas of glaciers are too crevassed or steep to measure.  Consequently, the resulting sparse network generates the question: how many points is enough and how well do the measurement points represent the area around them? 

The typical density and total number of measurements currently used in annual mass balance measurement is indicated in Table 1.   Measurement densities are usually below 10 points/km2. Hence, each point is assumed to accurately represent an area of 100,000 m2.   Mean densities are higher in the accumulation zone (16 points/km2), than in the ablation zone (5 points/km2).  The North Cascade Glacier Climate Project (NCGCP), utilizes the highest density of measurements 240 points/kmin the accumulation zone and 10 points/km2 in the ablation zone.

Determining the most efficient sampling pattern and identifying the overall accuracy of the sampling network is key to assessing error in annual mass balance measurement.  Llboutry (1974) and Cogley et al (1996 and 1999) and Fountain and Vecchia (1999) have approached this problem from a statistical standpoint and found that the number of measurement points can be fairly low 5-10 points/km2, but that the overall pattern of mass balance must be known.  Fountain and Vecchia (1999) found that five to ten measurement sites were sufficient to determine the mass balance of small glaciers. In this study,  we approach the issue of errors resulting from measurements networks of varying densities from a purely field measurement perspective.  Cogley (1999) pointed out that with a measurement network spaced at 50-100 m apart the largest source of uncertainty is the error in actual point mass balance measurement (>0.05m), and sampling error is negligible.  Cogley (1999) referred to the use of this density of measurements to eliminate all but measurement error, as reductio ad absurdum. 

This technique is precisely what we have used on Columbia Glacier in the North Cascades, Washington, and Lemon Creek Glacier Juneau Icefield, Alaska.  Both glaciers have a long annual mass balance record (Pelto, 1996; Miller and Pelto, 1999). We compared the mass balance results from a dense network of measurements with variously sparse networks, to determine the error resulting from using increasingly sparse networks.  The sparse networks used are each sub-samples of the larger network.  Each network of points was chosen to provide the most even distribution possible of measurements across each glacier, given the known mass balance pattern.

Glacier Characteristics

Columbia Glacier

Columbia Glacier is a south facing cirque glacier with a comparatively low slope for a small alpine glacier (0.15).  The glacier has the lowest mean elevation (1600 m) of any glacier over 0.5 km2 in the North Cascades.  In 1999 Columbia Glacier had an area of 0.87 km2.

This low mean elevation, despite its southern exposure, is due to the tremendous avalanching off of the 800 m-high cirque walls on the east and west sides of the glacier and the radiational shading the cirque walls provide (Figure 1) (Pelto,1996).   The mean annual balance of Columbia Glacier has been measured by the NCGCP since 1984, using 169 point measurements each year (Figure 2).   The mean annual balance of Columbia Glacier from 1984-1998 is –0.44 m/a, -6.55 m for the entire period (Figure 3) (Pelto, 1996).  This is a substantial loss for a glacier that averages less than 75 m in thickness.  The resultant glacier thinning, particularly pronounced near the terminus, has caused extensive glacier retreat. The glacier has retreated continuously during this century, 85 m since 1979. 

Lemon Creek Glacier

In 1998, Lemon Creek Glacier was 5.6 km long and had an area of 11.8 km(Figure 4) (Marcus et al., 1995).   From the head of the glacier at 1300 m to the mean Equilibrium Line Altitude (ELA) at an elevation of 1050-1100 m  the glacier flows northward.  In the ablation zone the glacier turns westward terminating at 600 m.    The glacier has four distinct topographic sections: 1) Steep peripheral northern and western margins draining into the main valley portion of the glacier; 2) A low slope ( 40) upper accumulation zone from 1220 m to 1050 m;  3) A steeper section (60) in the ablation zone as the glacier turns west from 1050-850 m;  4) An icefall (180) leading to the two-fingered terminus at 600 m. 

We determine annual balance on the Lemon Creek Glacier from a network of 8-30 points (Miller and Pelto, 1999).  The Lemon Creek Glacier annual balance record indicates that from 1957-1976 mass balance was –0.23 m/a and thinning was modest on the upper reaches of the glacier (Miller and Pelto, 1999).  Despite a higher mean elevation and a higher terminus elevation due to glacier retreat, mean annual balance has been increasingly negative since 1977, averaging -0.78 m/a.  The record is particularly negative since 1990, -1.04 m/a (Miller and Pelto, 1999).  This negative mass balance has fueled a terminal retreat of 800 m during the 1953-1998 period. 

Field Measurement Methods

On Columbia Glacier in the North Cascades, Washington and Lemon Creek Glacier Juneau Icefield, Alaska, we determined annual mass balance from measurement networks of varying density.  The lowest density network was 1 point/km2 on Lemon Creek Glacier and 10 points/km2on Columbia Glacier>  The highest density of measurements was 30 points/kmon Lemon Creek Glacier and 375 points/kmon Columbia Glacier.   Each network is spatially fixed with respect to the adjacent bedrock edges of the glacier and using differential GPS where necessary.  Each measurement transect on Columbia Glacier begins and ends at a fixed location at the edge of the glacier.  The distance between measurement sites is measured, thus deviations in measurement location are less than 15 m.  On Lemon Creek Glacier the deviations in measurement points was up to 50 m, the accuracy of the GPS units at that time.  

Mass balance is measured at the same point, using the same methods at the same time of the year on each glacier.  On Columbia Glacier the measurements were completed on August 1 or 2 each year from 1984-1998.  On Lemon Creek Glacier measurements were completed in July of 1984 and 1998.  The resultant mass balance reported here is not the actual annual balance reported for each glacier and determined at the end of the hydrologic year (October 1), but the specific mass balance of that date.  We used these dates because this is the time period when we have the available resources to complete the dense measurement network.

Accumulation Zone

In assessing the mass balance in the accumulation zone of Canadian, Norwegian, Swiss and United States glaciers the average density of measurements is 16 points/km(Pelto, 1996).   On Columbia Glacier, the typical density used in the mass balance measurements is 180 points/km2.  On Lemon Creek Glacier, the density ranges from 1-4 points/km2 (Miller and Pelto, 1999).  In this study the dense network on Columbia Glacier is 360 points/kmand on Lemon Creek Glacier 100 points/km2.  The mass balance measurement network covers a glacier’s entire accumulation zone with a consistent distribution of measurements (Figure 2 and 3). 

 Measurement of snow accumulation in the accumulation area was accomplished using probing and crevasse stratigraphy.  Probing has proved both successful and easy to use in most temperate and subpolar climate settings (Østrem and Brugman, 1991).  In the North Cascades and Juneau Icefield, all summers were notably warm, resulting in a 2-5 cm thick band of continuous, readily identifiable dirty-firn that resists penetration.   

Since North Cascade glaciers rarely have ice lenses, probing is an accurate method of measuring accumulation layer thickness. The probe is driven through the snowpack until the previous ablation surface is reached.    On the Juneau Icefield, ice lenses are more common but are discontinuous and, thus, repeat measurement are often required to verify that the previous annual layer has been reached.         

Crevasse stratigraphic measurements were conducted only in vertically-walled crevasses with distinguishable annual layer dirt bands.  Most of the vertically walled crevasses also tend to be less than 1 m across. 

The accuracy of crevasse stratigraphy and probing measurements are cross-checked at a minimum of 25% of the measurement sites by probing between crevasses.  Occasional errors revealed by this cross-checking include ice lenses that do not represent the annual layer in the case of probing, or in crevasses which do not yield representative accumulation depth in the case of crevasse stratigraphy. 

The standard deviation in snow depth obtained in cross-checking and duplicate measurements are smallest for crevasse stratigraphy, +0.02 m, and +0.03 m for probing.  The narrow range of deviation in vertically-walled crevasses indicates that they do yield consistent and representative accumulation depths late in the summer.   This is expected given the two dimensional view of crevasse stratigraphy versus a single dimension in snowpits and probing (Pelto, 1997).  In ice sheet areas distant from a dust source this maybe difficult, but on alpine glaciers mountaineers and glaciologists have long noticed the ubiquitous nature of these layers (Post and LaChapelle, 1962). 

In the North Cascades and Olympics, Washington, at the end of the summer snowpack density of the most recent winter’s retained accumulation is remarkably consistent (Pelto, 1996; Krimmel, 1998).  NCGCP completed more than 100 snowpits from 1984 to 1986 indicating that, the range in mean accumulation-layer density for a single glacier was 0.59-0.63  Mg/m 3.  Of equal importance was that the range of density variation is of the same order as the density measurement error, determined through repeat measurements.  Thus, density measurements are no longer completed during crevasse stratigraphy or probing.   As is the case on South Cascasde Glacier (Krimmel, 1998) the mean density used in our calculations of mass balance is 0.60 Mg/m3.  NCGCP routinely measured the snow density using a SIPRE corer at several location on each glacier each year, but has, to this date, found no deviation from the above noted range.   Snowpack density in April and May measurements show a significant range in density, which changes with time and must be considered in winter balance measurements.        

 On Lemon Creek Glacier, density was measured in a continuous profile through the snowpack during the measurement program at three locations.  The snowpack density was noted for its consistency, ranging from 0.54-0.56 in July, from year to year and place to place (LaChapelle, 1954; Miller and Pelto, 1999).

Figure 2. Mass balance map of Columbia Glacier
Figure 3. Mass balance map of the Lemon Creek Glacier.

Ablation Measurement

 In the ablation zone, wooden stakes were emplaced in a sequence from areas that lose their snowcover early in the summer to those that lose it late in the summer and not at all.  Ablation stakes were white wooden poles, 3.3 m long.  This length was chosen as longer stakes were too cumbersome to transport and emplace, and shorter stakes tend to melt out.  Ablation measurements were made at a minimum of six stakes on each glacier.  Measurements are made in late July and early August on Columbia Glacier, recording the ablation during the first three months of the ablation season, for water resource assessment purposes and redrilling of the stakes when necessary.  Ablation measurements were repeated in late September at the designated conclusion of the hydrologic year to determine total annual ablation.   On Lemon Creek Glacier, ablation measurements are completed each year in July.

In this study the observed ablation in July on Lemon Creek Glacier represents ablation since the previous July.  On Columbia Glacier the observed ablation in early August reflects the ablation since the redrilling in early August of the previous summer. 

Results

 We had the advantage of already understanding the overall mass balance pattern of each glacier in selecting measurement networks that would provide the most representative coverage for the glacier given the total number of measurements in each sample (Pelto, 1996; Miller and Pelto, 1999).  Each measurement was assumed to represent the glacier area surrounding that site.  Each measurement location for 10, 20, 40 and 80 measurement point networks was specifically selected as the best representative of the average mass balance of the surrounding region.  The decision was based on the existing detailed mass balance maps for each glacier.  We calculated the mass balance for each measurement network simply from the mean of all the observations, without biasing the results according to the representativeness of the specific sites. 

On Columbia Glacier, we used a measurement network with a maximum density of 375 points/ km2, and a maximum spacing between points of 90 m and a mean spacing of 45 m.  Annual mass balance (1984-1998) was typically determined on Columbia Glacier from a measurement network with a spacing of 187 points/ km(Pelto, 1996), and a mean spacing of 50 m.

 On Columbia Glacier, using 12 points/km(10 measurement points) yielded an error of –0.15 m/a, ranging from -0.07 m/a to –0.24 m/a.  For a network of 23 points/km2 (20 points), a consistent error of –0.05 to –0.10 m/a resulted (Table 2).  This measurement density provided an adequate measurement network to determine annual mass balance with an error of -0.10 m/a.  The error resulting from the use of 23 points/km2 was significant versus using either 46-388 points/ km2 ( 40-338 measurement points).  However, the consistency of the error for each year indicated by the parallel nature of the annual balance trendlines for the varying point networks suggests even greater accuracy was possible if the overall glacier balance distribution has been determined at some time using a denser measurement network (Figure 4).  There was no significant change in annual mass balance for measurement densities of 46-100 points/ km2 (40-84 points) compared to 23 points/km(20 points) (Figure 5).  There was a small consistent change in mass balance when either 194 points/ kmor 388 points/ km2 (169-338 measurment points) are utilized, in comparison to the smaller measurement densities.  The difference in calculated annual balance ranged from –0.06—0.10 m/a.  The lower measurement densities consistently underestimated annual balance.  There is no significant difference between the mass balance observed at 169 versus 338 locations.

Figure 4. Variation in measured annual balance on Columbia Glacier for each year, 1988-1998 depending on the number of mass balance measurement points used.

On Lemon Creek Glacier we used a measurement network with a maximum density of 30 points/km2.   The mass balance determined from a density of 1 to 2 points/km(10 and 20 measurement sites) was significantly in error, unlike on Columbia Glacier this error is not consistently negative, overestimating mass balance in 1984 and underestimating mass balance in 1998 (Figure 6).  A measurement network of 1 point/ kmyielded an error of +0.15 m/a, ranging from -0.07m/a to –0.24 m/a.  Using a network of 2 points/km2 yielded an error of 0.10 m/a in annual balance for a measurement network of greater than 2 points/ km2.  The mass balance determined from a network of 4 to 32 points/km(40 to 320 measurement sites) yielded no significant difference in observed annual balance.  Thus, on Lemon Creek Glacier, a density of 4 points/kmwas adequate for annual mass balance determination.

  The variation from mass balance between any two adjacent sites on Lemon Creek Glacier was low, a mean of  + 0.07 m compared to that of + 0.35 m at Columbia Glacier.  This greater variation, despite the fact that the mean spacing of the sites was 50 m on Columbia Glacier and 175 m on Lemon Creek Glacier.  Thus, the measurement density necessary to yield reasonably accurate mass balance values was lower for Lemon Creek Glacier.  The sheer size of the glacier caused the total required measurements to be similar to achieve reasonable accuracy.  This was an expected result given that the majority of the Lemon Creek Glacier shares much more homogenous topographic characteristics compared to Columbia Glacier.

In order to achieve optimal accuracy, it is apparent that multiple measurements are needed in each specific mass balance zone of the glacier.  If a glacier has large homogeneous areas this reduces the measurement density (Lemon Creek Glacier), if it has many small unique mass balance zones a higher measurement density is required (Columbia Glacier).  

Conclusions

To ascertain the annual balance of a glacier from a sparse network of observations is optimized by detailed mapping of mass balance across the glacier determined from a high-density measurement network during several years.  Given that this has been accomplished on a small alpine glacier such as the Columbia Glacier, a measurement density of 46 points/km2 (40 points) yielded accurate results.  On the larger Lemon Creek Glacier the measurement density needed to achieve reasonable accuracy was 4 points/km(40 points).  In both cases the total number of measurements necessary to achieve consistent accuracy within +0.10 was 40 points.  Statistical tests can be applied to compensate for lower measurement densities, however, this always entails assumptions. 

The aim of this study was to illustrate the minimum number of measurements needed to determine annual mass balance accurately from field measurements alone.   The results confirm Fountain and Vecchia (1999) conclusion that the number of measurements necessary to determine mass balance on small alpine glaciers is scale invariant, in this case that 40 points satisfactorily minimized errors on both glaciers.

Table 1. The number of measurement sites used and their density in km2 in mass balance studies on selected glaciers: In Switzerland (A)(Herren, Hoelze, and Maisch, 1999), by the Canadian Inland Water Directorate (C)(Young and Ommanney, 1984) by the United States Geological Survey (UW)(Krimmel: 1998) (UA)(March and Trabant, 1995), by the Norges Vassdrags-Elektrissen (N) (Østrem et al. 1980), and by the North Cascade Glacier Climate Project (P)(Pelto, 1996).
Table 2. The annual balance in meters of water equivalent determined from field measurements networks of varying number of measurement sites on Columbia Glacier. The fewer the number of measurements the more negative the annual balance calculated.
Table 3. The observed annual balance on Lemon Creek Glacier determined from field measurements of varying density in meters of water equivalent.

References

Cogley, J.G. 1999.  Effective sample size for glacier mass balance.  Geogr. Ann. 81:  79-86.

Cogley, J.G. Adams, W.P., M.A. Ecclestone, Jung-Rothenhausler, F. and Ommanney, C.S.L. 1996.  Mass balance of White Glacier, Axel HeibergIsland N.W.T., Canada, 1960-1991.  J of Glaciol. 42: 548-563.

Fountain, A., Trabant, D., Brugman, M., Ommanney, C. and Munro, D., 1991. Glacier mass balance standards.  EOS 72(46): 511-514.

Fountain, A., and Vecchia, A.  1999.  How many stakes are required to measured the mass balance of a glacier.  Geo. Ann. 81(A), 563-568.

Herren, E.R., Hoelzle, M. and Maisch, M.  1999.  The Swiss Glaciers 1995/96 and 1996/97.  Swiss Academy of Sciences, Glaciological Commission, Glaciological Report no. 117-118.

IPCC, 1996.  Climate Change 1995- Contributions of working group I to the second  assessment of the Intergovernmental Panel on Climate Change. Cambridge University Press.

 Krimmel, R.M. 1998.  Water, ice and meteorological measurements at SouthCascade  Glacier,  Washington, 1997 Balance Year. USGS WRI-98-4090.

LaChapelle, E.  1954. Snow Studies on the Juneau Icefield.  Am. Geogr. Soc.,Juneau Icefield Research Project Report no. 9.

Lliboutry, L. 1974. Multivariate statistical analysis of glacier annual balances.  J Glaciol., 13: 371-392.

March, R.S. and Trabant D.C. 1995.  Mass balance, Meteorological, Ice Motion, Surface Altitude and Runoff  Data at Gulkana Glacier, Alaska, 1992 Balance Year.  USGS WRI-95-4277.

Marcus, M.G., Chambers, F.B., Miller, M.M. and Lang, M., 1995: Recent trends in The Lemon Creek Glacier, Alaska.  Phys. Geogr., 16(2): 150-161.

Miller, M.M. and Pelto M.S. 1999.  Mass balance measurements on the LemonCreek Glacier, Juneau Icefield, Alaska 1953-1998. Geogr. Ann., 81: 671-681.

Østrem, G. and Brugman, M. 1991: Glacier Mass-Balance Measurements. Canadian NHRI Science Rep. no. 4.

Paterson, W.S.B. 1994.  The Physics of Glaciers, 3rd Ed.  Pergamon Press, OxfordUK, 480 p.

Pelto, M.S. 1996. Annual net balance of North Cascade glaciers, 1984-1994.  J. of Glaciol., 42(140): 3-9.

Pelto, M.S., 1997:  Reply to comments of Meier and others on “Annual net balance of North Cascade glaciers 1984-1994” by M. S. Pelto.  J of Glaciol., 43(143):193-196.

Post, A.S. and LaChapelle, E.R., 1962: Glacier Ice.  The Mountaineers andUniversity of Washington Presss, Seattle WA.

Walters, R.A. and Meier, M.F. 1989. Variability of glacier mass balances in Western North America.  In Peterson, D.H., Aspects of climatevariability in the Pacific and western Americas.  AGU, Geophysical Mono. 55: 365-374.

Wold, B and Haakensen, N.  1981.  Glasiologiske Undersokelser 1 Norge 1979. NVE, Rapport 3-81.

Young, G.J. and Ommanney, C.S.L. 1984.  Canadian hydrology and mass balancestudies. Geogr. Ann., 66A: 169-182.