Nooksack River: Glacier Runoff Maintains Suitable Aquatic Conditions for Salmon
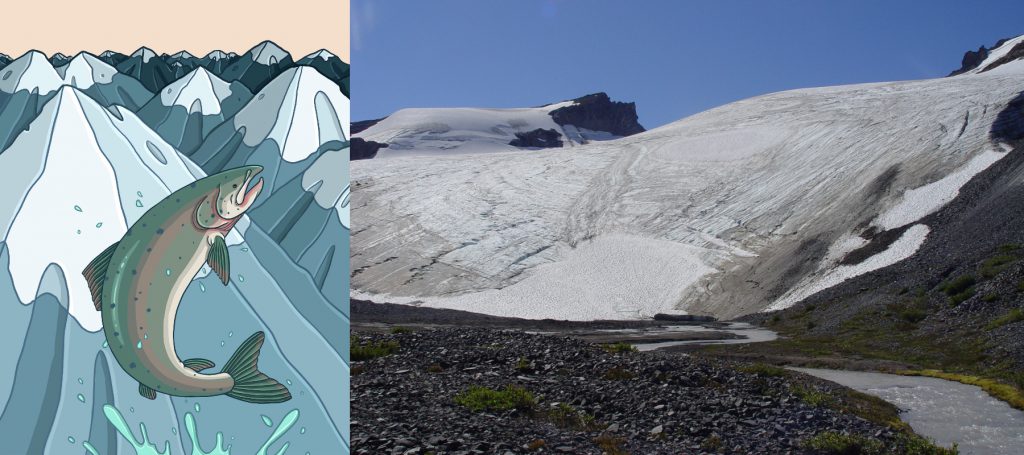
Glaciers are a critical water resource in the North Cascades of Washington for hydropower, irrigation, municipal supply and aquatic life. In dry summers glaciers play an even larger role in the overall water budget and maintaining suitable aquatic conditions. The summer of 2015 posed particular challenges due to the drought emergency that developed and persisted. During 2013-2021 period in an ongoing study with the Nooksack Indian Tribe we worked on quantifying the role glaciers play in that watershed. Glaciers comprise the headwaters of the Nooksack River and are a critical source of summer discharge and greatly influence summer stream temperatures. There are nine species of salmon in the watershed that the Nooksack Indian Tribe depends on for cultural, subsistence, and economic uses.
Glacier runoff in the Nooksack Basin is a major source of streamflow during the summer low-flow season and mitigates both low flow and warm water temperatures; this is particularly true during summer heat waves. Synchronous observations of glacier ablation and stream discharge immediately below Sholes Glacier from 2013–2021, independently identify daily discharge during the ablation season. The identified ablation rate is applied to glaciers across the North Fork Nooksack watershed, providing daily glacier runoff discharge to the North Fork Nooksack River. This is compared to observed daily discharge and temperature data of the North Fork Nooksack River and the unglaciated South Fork Nooksack River from the USGS. The ameliorating role of glacier runoff on discharge and water temperature is examined during 24 late summer heat wave events from 2010–2021. The primary response to these events is increased discharge in the heavily glaciated North Fork, and increased stream temperature in the unglaciated South Fork. During the 24 heat events, the discharge increased an average of +24% (±17%) in the North Fork and decreased an average of 20% (±8%) in the South Fork. For water temperature the mean increase was 0.7 °C (±0.4 °C) in the North Fork and 2.1 °C (±1.2 °C) in the South Fork. For the North Fork glacier runoff production was equivalent to 34% of the total discharge during the 24 events. Ongoing climate change will likely cause further decreases in summer baseflow and summer baseflow, along with an increase in water temperature potentially exceeding tolerance levels of several Pacific salmonid species that would further stress this population.
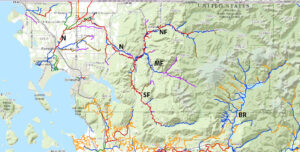
Nooksack Watershed map with Mount Baker glaciers with the range of slamon indicated.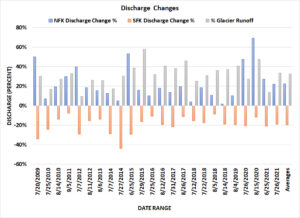
Change in stream discharge in the glaciated North Fork (blue) an unglaciated South Fork during heat waves. The.impact of heat waves on discharge +23% in glacierated North Fork -20% in unglaciated south Fork
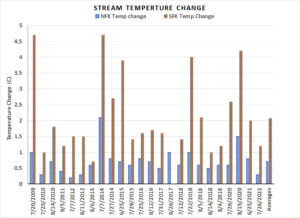
Change in stream temperature in the glaciated North Fork (blue) an unglaciated South Fork during heat waves.
This post will focus on the changing impact of glaciers on streamflow and the evolving water temperature threat. The Nooksack River watershed has three significant watersheds, South Fork, Middle Fork and North Fork. The South Fork has no glaciers. The Middle Fork has four significant glaciers and 2% of the watershed area above the USGS gage is glaciated. The North Fork has 12 significant glaciers that cover 6% of the watershed area above the USGS gage. This difference in glacier cover allows identification of the role of glaciers when combined with measurements of melt on and runoff from the glaciers. Here we examine stream discharge and water temperature at USGS gages on each stream to illustrate the different response to 12 warm weather events during the summers of 2009, 2010, 2012 and 2013. During each of these periods we have, along with Oliver Grah and Jezra Beaulieu, working for the Nooksack Tribe, been observing the ablation and runoff directly from the glaciers. The largest area of glaciers are those on Mount Baker, a strato volcano that is the highest mountain in the North Cascades. Pelto and Brown (2012) note that terminus observations on the nine principal Mount Baker glaciers, 1984–2009, indicate retreat ranging from 240 to 520 m, with a mean of 370 m or 14 m/year. Pelto and Brown (2012) observed that this is the result of a sustained mass balance loss averaging -0.5 m/year during the 1990-2010 period. This equates to an 11-m loss in glacier thickness, 12–20% of the entire 1990 volume of glaciers on Mount Baker. This summer we will for the 32nd consecutive year be measuring glacier mass balance on Mount Baker.
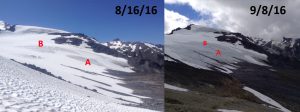
Sholes Glacier snowpack loss and ablation in 2016.
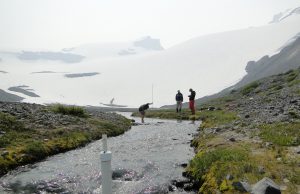
Runoff measurement Gage below Sholes Glacier
For stream discharge, a 10% increase is set as the key threshold for significant response to each warm weather event. For the North Fork 18 of 24 warm weather events exceeded the limit, iand for the South Fork none of the 12 events led to a 10% flow increase. It is apparent that warm weather events increase glacier melt, thus enhancing flow in the North Fork on average by 23%.. In a basin without glacier runoff the hydrologic system consistently experiences reduced discharge by 20%.
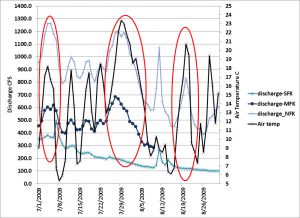
2009 stream discharge variation of the three Nooksack forks, warm water events within ellipse.
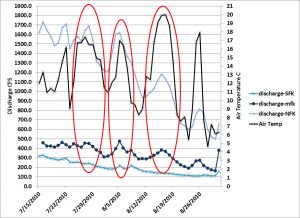
2010 stream discharge variation of the three Nooksack forks, warm water events within ellipse.
For water temperature, an increase of 1.5° C is the threshold of significance used for response to warm weather events. In each the North Fork and Middle Fork, 2 of 24 events exceeded this threshold, and for the South Fork 16 of 24 events exceeded this threshold, each event is a gold ellipse on the charts below. Warm weather events consistently generate a significant increase in stream water temperature only in the non-glaciated South Fork Basin. During 6 of these 12 warm events, runoff measurements below Sholes Glacier and ablation measurements on Sholes and Easton Glacier indicate daily ablation ranging from 0.05-0.06 meters per day, which for the North Fork currently yields 9.5-11 m3/second. This is 40-50% of the August mean discharge of 24 m3/second, despite glaciers only covering 6% of the watershed. Increased glacier discharge largely offset the impact of increased air temperature on stream water temperature during the warm weather events. In the charts below note the red line with diamond markers that is the South Fork stream temperature and the in the graph above the top brightest blue line that is North Fork discharge and what happens during the warm events, gold ellipses. Also note the South Fork discharge bottom blue line in the graph above does not respond nor does the North Fork stream temperature red line with triangles, below.
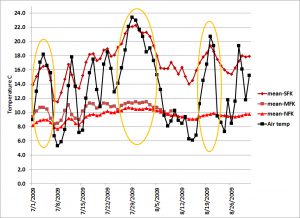
2009 Temperature record for the South Fork, North Fork and Middle Fork, warm water events within ellipse.
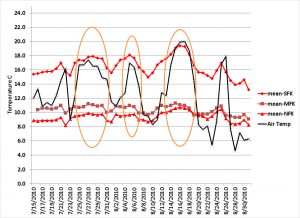
2010 Temperature record for the South Fork, North Fork and Middle Fork, warm water events within ellipse.
As the glaciers continue to retreat the North Fork will trend first toward the more limited impact of the Middle Fork and then the highly sensitive South Fork where warm weather leads to declining streamflow and warming temperatures. Our ongoing measurements of daily runoff and daily streamflow below Sholes Glacier allow determination of the contribution of glaciers to the North Fork Nooksack, which peaked in 2014 at 80% of total streamflow. Reductions in glacier runoff will put stress on the salmon in the watershed. The Washington Dept of Fish and Wildlife monitors the salmon population, which in the North Fork migrate 40 km upstream of the junction with Nooksack River to Nooksack Falls. The salmon population which is threatened, shows no sign of recovery in the last decade, the good returns in 2002 reflect good water conditions in 1999-2000 for salmon fry.
Continued glacier loss and reduced summer streamflow will lead to a situation similar to the Skykomish River where the number of low flow days has sharply increased. The retreating glaciers include the Sholes, Roosevelt, Coleman, Deming and Mazama
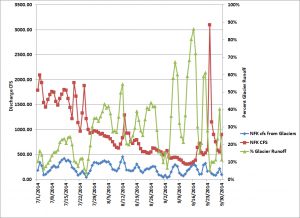
Glacier runoff in the North Fork Nooksack in 2014, product of observed ablation and glacier area, also percent of total flow.
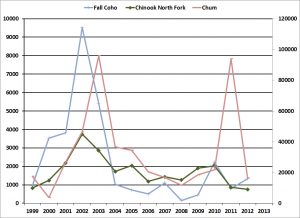
Chinook Salmon Counts in Nooksack River have not recovered.