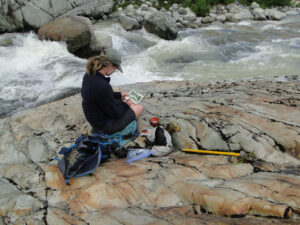
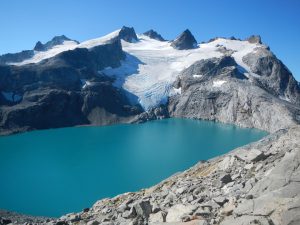
Runoff from Columbia Glacier, headwater being sketched by Jill Pelto North Fork Skykomish River.
Glaciers are natural frozen reservoirs storing water without a dam. Glaciers runoff is highest during the warmest, driest periods of summer, when all other sources of water are at a minimum. Watersheds in mountainous Pacific Northwest are comprised of rain fed, snow melt fed and glacial runoff fed segments. The rain fed segments have peak flows in the winter due to the winter storm events (Dery et al., 2009). Snow melt streams peak in the May and June with the high snowmelt, and glacially fed streams peak in July and August during peak glacier melt (Pelto, 2008; Dery et al., 2009). The loss of glaciers from a watershed reduces streamflow primarily during minimum flow periods. As a result, in glaciated watersheds glacier runoff is of particular importance to aquatic life in late summer and early fall when other water sources are at a minimum, raising minimum streamflow and reducing maximum temperatures. This drought buffering ability of glaciers will decline as they decline (Ultee et al 2022). Here we explore that consequence in the Skykomish River.
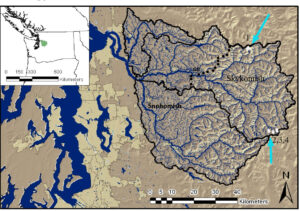
Figure 1 Map of Skykomish River watershed, glacier indicated by light blue arrows.
The Skykomish River watershed drains the west slope of the North Cascades (Figure 1). The USGS has a long-term gaging station at Gold Bar, downstream of the junction of the North Fork and South Fork Skykomish River, where the river exits the Cascade Mountains. The Skykomish River is core summer habitat for salmon, Chinook Salmon are listed as threatened in the Skykomish River system [Svrjcek et al 2013]. The river has a persistent high water temperature impairment that impacts salmon[Svrjcek et al 2013]. The decline in glacier area in the Skykomish Basin is greater than the increased rate of ablation, as a result peak runoff had been reached prior to 2009 and the dominant ongoing change in glacier runoff is a decline in summer streamflow due to glacier area reductions [Pelto, 2011].
Glacier Change
The North Cascade Glacier Climate has monitored the mass balance of the two largest glaciers, Columbia Glacier, and Lynch Glacier, in the watershed from 1984-2023 and the third largest Foss Glacier from 1984-2014, when it fragmented, and measurements were discontinued.
From 1984-2023 the mean annual balance of Columbia Glacier has been -0.64 m w.e., a cumulative loss of 25.6 m w.e. From 1984-2023 Lynch Glacier has had a mean annual balance of -0.64 m w.e., a cumulative loss of 25.4 m w.e. The mass balance losses have driven the reduction in glacier area. In the last decade (2014-2023) the mass losses have been consistent and greater than the long term mean at –1.42 m w.e. annually.
The other six glaciers in the watershed have disappeared between 2005 and 2023 and are noted as extinct in the Global Land Ice Measurements from Space glacier viewer (GLIMS). Lynch and Columbia Glacier comprise 88% of the total glaciated area in the basin in 2023, up from 37% in 1958. In the Skykomish River watershed from 1958-2023 glacier area declined from 4.5 km2 to 1.3km2, a 45% decline (Pelto, 2011). Columbia, Foss, Hinman and Lynch Glacier, the primary glaciers in the basin, declined in area by 25%, 80%, 90% and 40% respectively since 1958. Annual mass balance measurements completed from 1984-2009 on Columbia, Foss and Lynch Glacier indicate a mass loss of 13.1 m w.e. Despite 15% higher ablation rates during the 1985-2009 period, the 45% reduction in glacier area led to a 38% reduction glacier runoff between 1958 and 2009. This means less glacier runoff in late summer.
| Glacier | GLIMS ID | 1958 | 2015 | 2023 | Year Lost |
| Kyes Peak | G238660E47969N | 0.087 | 0.068 | 0.041 | 2022 |
| Hinman Glacier | G238769E47576N | 1.259 | 0.119 | 0.034 | 2022 |
| Columbia Peak | G238641E47960N | 0.058 | 0.036 | 0.023 | 2015 |
| Lynch Gap | G238804E47571N | 0.291 | 0.004 | 2015 | |
| West Lynch | G238809E47571N | 0.133 | 0 | 2015 | |
| Diptop | G238823E47586N | 0.118 | 0.068 | 0.008 | 2021 |
| Columbia Glacier | G238651E47961N | 0.802 | 0.626 | 0.64 | |
| Foss Glacier | G238788E47571N | 0.905 | 0.326 | 0.14 | |
| Lynch Glacier | G238821E47572N | 0.878 | 0.478 | 0.45 | |
| Total | 4.531 | 1.721 | 1.34 |
Table 1. Evolution of glacier area (km2) of the nine glaciers in the Skykomish Basin, only three are left. Areas for 1958 and 2015 are from GLIMS observations.
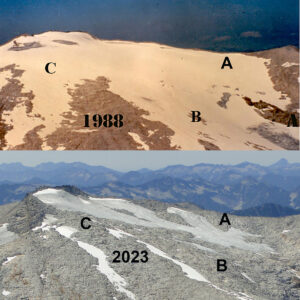
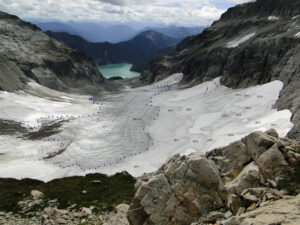
Foss Glacier retreat 1988-2023
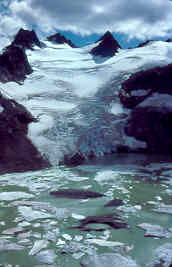
Lynch Glacier Retreat 1978 (Bill Prater) and 2015.
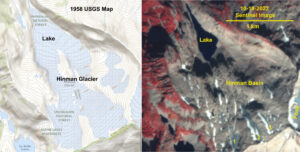
Hinman Glacier retreat, having lost 90% of its area and was no longer a glacier in 2022.
Columbia Glacier losing its snowcover in the accumulation zone in 2015, firn layers from previous years listed.
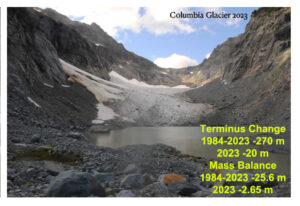
Columbia Glacier Retreat. Detailed report.
Stream Discharge
A key threshold of in-stream flow levels considered insufficient to maintain short term survival of fish stocks is below 10% of the mean annual flow [Tennant, 1976]]. For the Skykomish River 10% of mean annual flow is 14 m3s-1. In the Skykomish River from 1958-2023 there were 390 melt season days with discharge below 14 m3s-1. Of these only three occurred before 1985, and 74% have occurred since 2000. The loss of significant glacier runoff is a key reason for the increase of low flow days [Pelto et al 2022]. Of more concern for aquatic life is the occurrence of extended periods of low flow 14. From 1929-2023 in the Skykomish River basin there have been 14 years where streamflow dropped below 14 m3s-1 for 10 consecutive days during the melt season, 1986, 1987, 1992, 1998, 2003, 2005, 2006, 2007, 2015, 2017, 2019, 2021, 2022 and 2023. In 2022 this occurred beginning on Sept. 9 after stream temperatures had declined from elevated levels. In 2023 stream discharge dropped below this level on Aug.11 and remained below this threshold until Sept. 25th, except for Aug. 30 and 31. Of greatest concern for aquatic life is the occurrence of extended periods of low flow that have increased in frequency coinciding with high stream temperatures, such as occurred in 2015.
A comparison of observed glacier runoff during several heat wave periods provides a direct measure of the contribution of glaciers to the Skykomish River (Table 2). Despite similar melt rates during each heat wave glacier discharge during the heat waves has declined from over 2.5 m3s-1 to below 1.5 m3s-1. This 1 m3s-1 decline occurred over the last 30 years as glacier area declined. The percentage of Skykomish discharge provided by glacier runoff has fallen below 7% during heat wave periods in 2017, 2021 and 2022. The two heat wave periods that coincided with a low flow period were in 2015 and 2023. Glacier runoff declined by 33% leading to glacier runoff providing less buffering 8.9% of total discharge vs 12.87% in 2015.
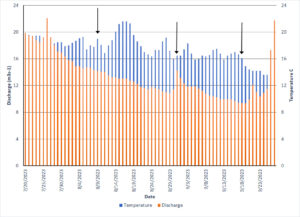
Stream discharge and temperature in the Skykomish River at Gold Bar from the USGS station. Arrows indicate when threshold for temperature and discharge were exceeded, beginning on August 10th, interrupted for one day on Aug 31st, and ending on Sept. 17.
| Year | Date of Heat Wave | Skykomish River Discharge (m3s-1) | Glacier Discharge (m3s-1) | % Glacier runoff |
| 1992 | 8-10 to 8-14 | 20.18 | 2.66 | 13.18% |
| 2004 | 8-10 to 8-16 | 19.26 | 2.04 | 10.62% |
| 2015 | 7-31 to 8-4 | 10.86 | 1.58 | 12.87% |
| 2017 | 8-1 to 8-5 | 24.17 | 1.45 | 6.01% |
| 2021 | 7-31 to 8-5 | 26.59 | 1.37 | 5.17% |
| 2022 | 7-30 to 8-3 | 40.66 | 1.49 | 3.67% |
| 2023 | 8-14 to 8-18 | 13.02 | 1.07 | 8.9% |
Table 3. Observed river discharge at the USGS station in Gold Bar, calculated glacier discharge from field observation during this period and percent of total streamflow provided by glacier runoff.
Stream Temperature
Rates of warming in the Pacific Northwest’s rivers have been highest during the summer, an increase of 0.17°C per decade [Isaak et al 2012]. Air temperature was the dominant factor in both long term and inter-annual variability for Pacific Northwest rivers [Isaak et al 2012]. Discharge and air temperature appear additive and the seasonal variation in stream warming rates is determined by the degree of concert between these two variables [Isaak et al 2012]. For example, the largest warming trend during the summer resulted from the effects of the largest air temperature increases added to the largest river discharge decreases [Luce et al 2014]. An important impact of changing glacier runoff in the Skykomish River is the stress of warming stream temperatures on salmon populations [Svrjcek et al 2013]. Temperature thresholds for changes in fish communities in the Fraser River region of British Columbia were noted as 12oC and 19oC [Parkinson et al 2015].
The Skykomish River was listed as impaired for temperature in a 2008 303(d) listing and proposed 2010 303(d) listing [Svrjcek et al 2013]. Several segments of the Skykomish River as well as its tributaries consistently exceed water quality temperature standards [Svrjcek et al 2013]. During select summer periods from 2001-2006, temperature monitoring in the Skykomish River at Monroe indicated that the average 7-Day maximum frequently exceeded the 16°C criteria between July and September in 2001-2006. In Monroe, WA 6 km downstream of Gold Bar exceedances ranged from 60% – 100% [Svrjcek et al 2013].
A water temperature sensor became operational in early July 2022 at the USGS Gold Bar site. The temperature exceeded 18oC for the first time on July 27. It surpassed 18oC diurnally on most days from July 27-September 7, 37 of 42 days. The TMDL for the Skykomish River indicates the maximum temperature should not exceed 16oC for 7 consecutive days. In 2022 the 16oC threshold was exceeded continuously from July 26th to August 4th, August 14th-August 28th, and August 29th to September 4th. In 2023 the 16oC threshold was exceeded continuously from July 27th to August 21st, coinciding with the period of low flow from August 11th-August 21st.
There was a single period of 7 or more consecutive days exceeding 16oC in summer 2023, that lasted for 25 days. Fall Chinook, which were first listed as threatened in 1999 in the basin are particularly vulnerable [State of Salmon]. Chinook escapement levels have remained below abundance minimum threshold levels annually from 2010-2021 and have been less than 15% of the recovery level population [State of Salmon]. The summers of 2021-2023 were particularly stressful, the data have not yet been reported for 2022 or 2023.,