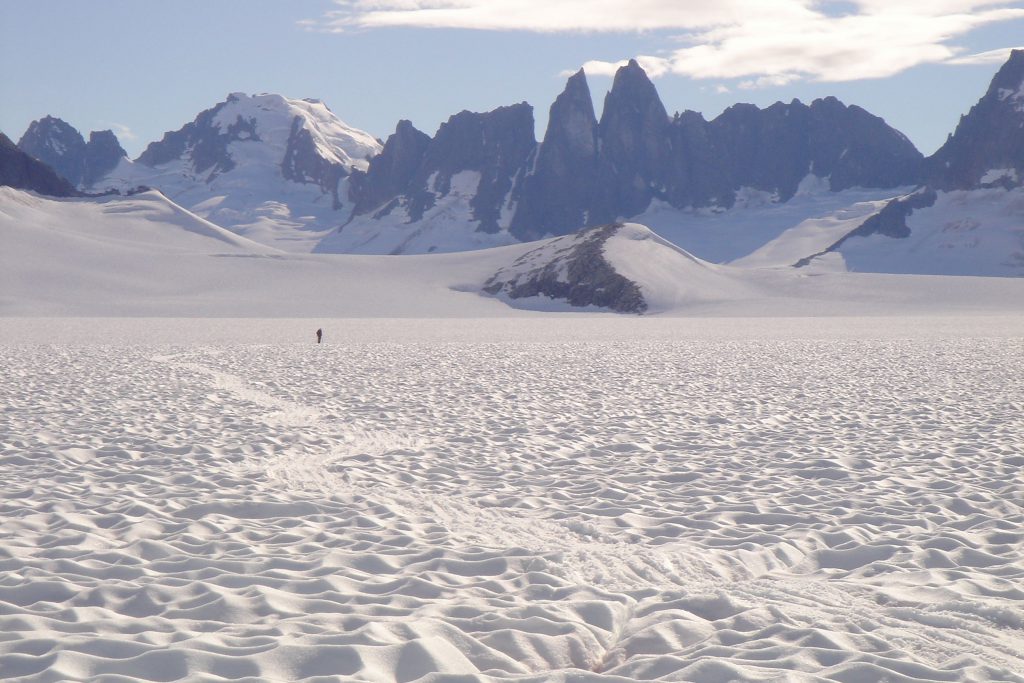
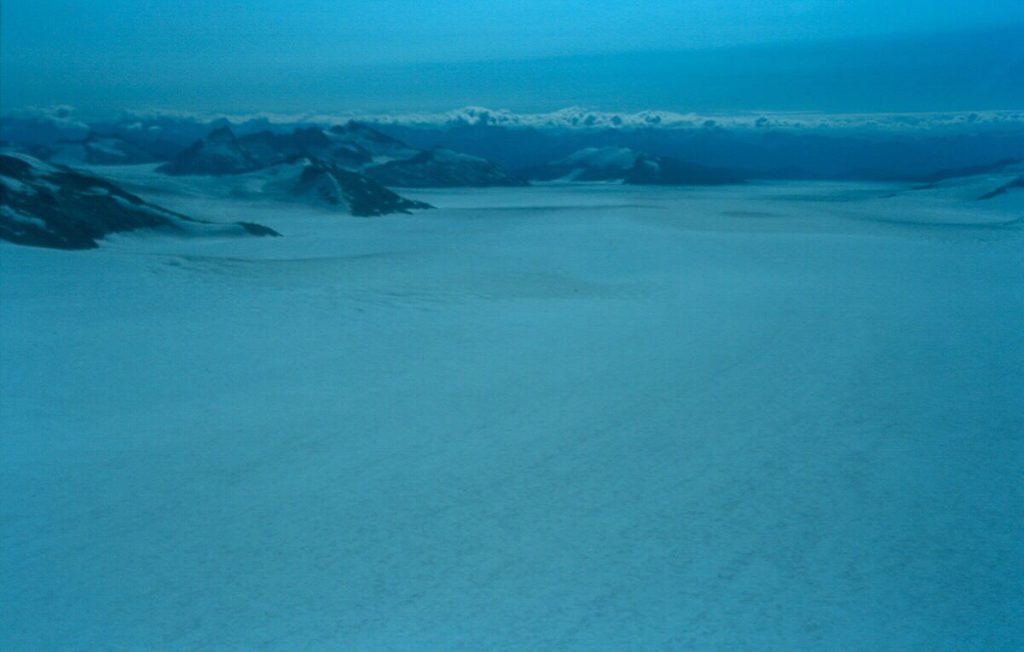
Taku Glacier
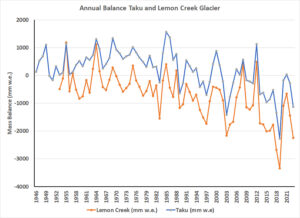
The annual balance record for the Taku Glacier assembled from existing JIRP data provides the longest continuous record in North America. The Taku Glacier, Alaska has advanced 7.3 km since the late nineteenth century. The thickest known alpine temperate glacier, it has a maximum measured depth of 1480 m. The Taku is a tidewater glacier that formerly calved, but is now advancing slowly over its outwash delta. The glacier had a dominantly positive mass balance from 1946-1988 and a slightly negative balance since 1988. On Taku Glacier, the annual ELA has risen 60 m from the 1946-1985 period to the 1986-2011 period. Mass balance during the two periods were +0.40 and -0.08 m w.e.a-1, respectively, indicative of the snowline rise resulting in cessation of the long term thickening of the glacier (Table1). This overall mass balance change from 1946-2011 is +13.7 m w.e. (Fig. 4). The long term positive mass balance is continuing to drive its advance (Pelto and Miller, 1990; Post and Motyka, 1995; Pelto et al., 2008). All other outlet glaciers of the Juneau Icefield are retreating, and are thus consistent with the dominantly negative alpine glacier mass balance that has been observed globally (Pelto 2017; Zemp et al., 2009).
2008 Publication: Pelto et al. The equilibrium flow and mass balance of Taku Glacier 1950-2006. The Cryosphere 2, 275-298.
2011 Publication. Utility of late summer transient snowline migration rate on Taku Glacier, Alaska
2013 Publication: Pelto et al. Juneau Icefield Mass Balance Program 1946-2011
2017 Publication. Recent Climate Change Impacts on Mountain Glaciers-Chapter 3
Introduction
Taku Glacier is divided into three zones that describe both mass balance and flow dynamics: (1) The ablation zone, below the mean annual ELA of 925 m (113km2), descends the trunk valley with no tributaries joining the glacier, and only the distributary tongue, Hole in the Wall, leaving the glacier 11 km above the terminus. (2) The lower neve zone, extending for 425 m in elevation above the ELA, is a zone where summer ablation is significant (178km2). All the main tributaries (Southwest, West, Matthes, Demorest, and Hades Highway) join in this zone. (3) The upper neve zone extends from 1350 m to the head of the glacier (380 km2), comprising the principal accumulation region for each tributary except the Southwest Branch. Ablation is limited in this zone, with much of the summer meltwater refreezing within the firnpack. The Taku Glacier has been advancing since 1890: It advanced 5.3 km between 1890 and 1948, continuing its advance 2.0 km since 1948 (Moytka and Post, 199; Pelto and Miller, 1990). The slowing of the advance has been attributed to the impedance of the terminus outwash plain shoal (Motyka and Post, 1995 ), but it has also been conjectured as due to the inability of the mass balance to sustain this advance. With an AAR of 82, Taku Glacier will continue to have a positive mass balance given the current climate.
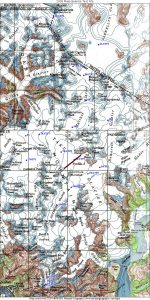
JIRP has measured the annual balance of the Taku Glacier from 1946 to 2000 (e.g., Pelto and Miller, 1990). Glacier annual mass balance is the difference between the net snow accumulation and net ablation over one hydrologic year. On non-calving glaciers, such as the present Taku Glacier, surface mass balance observations are used to identify changes in glacier volume. JIRP has relied on applying consistent methods at standard measurement sites (Pelto and Miller, 1990; Miller and Pelto, 1999). The Taku Glacier measurement network consists of 18 locations where mass balance has been assessed in test pits annually since 1946. The majority of the pits are in the region from 950-1400 m. In 1984 and 1998, JIRP measured the mass balance at an additional 500 points in the accumulation area to better determine the distribution of accumulation around these control points. Measurements were taken along profiles at approximately 250 m intervals. The standard deviation for sites within 3 km, with less than a 100 m elevation change, was +0.09 m/a; this indicates the consistency of mass balance around the control sites. In addition, the glacier surface elevation has been determined annually since 1993 on specific tranverse profiles at the same locations, determined using differential GPS. This provides an independent measure of mass balance. The observed mass balance is used to provide mass balance contours for the glacier. The product of the observed balance and the area within the contour interval yields the mass balance for that area. The sum of all of these products yields the mass balance for the entire glacier.
Three specific problems have been noted in the initial publication of the mass balance records for these two glaciers (Pelto and Miller, 1990): 1) Field measurements are usually concluded in August, one month prior to the end of the ablation season; 2) surface ablation can reaccumulate as ice lenses and layers, and not escape the glacier system; and 3) only sparse and inconsistent measurement of ablation in the ablation zone has been completed.
Validation
The Taku Glacier mass balance record has been confirmed by independent observation of glacier surface elevation change using the ongoing laser altimetry by the University of Alaska, Fairbanks (Echelmeyer et al., 1996; Arendt et al., 2002; Larsen et. al., 2007). This was accomplished from a centerline profile providing a mean glacier thickness change. Surface elevation change is not strictly a measure of mass balance, though it is reported as such (Arendt, 2006). Surface dynamics can also play a role. On Taku Glacier in the vicinity of the ELA annual velocity surveys indicate a consistent ice dynamics from 1950-2006, indicating that surface elevation change should mostly reflect surface mass balance (Pelto et al, 2008). The observed change in Taku Glacier surface elevation was +0.69 ma-1 from 1948-1993 and -0.28 ma-1 from 1993-1997 (Arendt, 2006). The observed mass balance for these periods from field observations is +0.38 ma-1 for 1948-1993 and -0.60 ma-1 for 1993-1997. The surface record includes the large negative mass balance of 1997, while the laser altimetry only includes part of the 1997 ablation season and would tend to underestimate thinning by a small amount (Echelmeyer et al., 1996). Repeat laser altimetry profiling indicates a Ba of -0.21 ma-1 for the 1993-2007 period, compared to the JIRP mean Ba of -0.16 ma-1. A comparison of surface elevations from the 2000 Shuttle Radar Topography Mission and a DEM derived from the 1948 USGS mapping indicates a mean Ba of +0.45 ma-1 versus the JIRP record of +0.27 ma-1 for the 1948-2000 period (Larsen et al., 2007). The long term observed ice surface elevation changes taken over varied periods using different techniques validates the accuracy of the mass balance record of the Taku Glacier.
Mass balance measurements began in 1946 and are continued today, resulting in a mass balance time series equal to that of Storglaciaren, Sweden, which is commonly noted as being the longest mass balance record on the globe. Pelto and Miller (1990) presented the mass balance trends on the Taku Glacier from 1946 to 1986, introducing JIRP mass balance methodology mass balance trends, and recent Taku Glacier history. Pelto and Miller (1990) divide the Taku Glacier’s mass balance record into six segments, 1) 1946 to 1949 with positive mass balance, 2) 1950 to 1957 with negative mass balance, 3) 1958 to 1962 a period with increasing mass balance, 4) 1964 to 1975 a period with positive mass balance, 5) 1976 to 1983 substantially less positive mass balance, and 6) 1984 to 1988 with strong positive mass balance (Figure 5). The key to the positive mass balance which in turn drives glacier advance is the exceptionally high Accumulation Area Ratio (AAR). The AAR is the percentage of the glaciers area that is typically snowcovered at the end of the summer, it needs to be higher than 67 for a non-claving glacier such as the Taku is at present to be in equilibrium. The mean AAR for the Taku glacier has averaged close to 90 from 1946-1986, but has been closer to 75 during many of the years since 1990.
While the annual mass balance of Taku Glacier has been periodically negative the general regime is one of positive mass balance and net mass gain. The average annual mass balance from the period 1946 to 1986 on Taku Glacier was +0.37 m/yr ± 0.06 m/yr.
Pelto and Miller (1990) state that the mass balance of glaciers in Southeast Alaska are dictated by the calving flux, percentage of a glacier’s surface area within the maximum accumulation area (MAA), and most importantly, the percentage of a glacier’s total area above the Equilibrium Line Altitude (ELA), or accumulation area ratio (AAR). For glaciers that do not surge or possess negligible calving flux, changes in MAA and AAR dictate a glacier’s regimen (advance, retreat or equilibrium). When certain threshold values are crossed a glacier can switch from one regime to another. Pelto (1987) found these threshold values for AAR and MAA to be 67 and 50 respectively. The Taku Glacier does not surge and has experienced little to no calving since 1946, thus AAR and MAA should dictate its regime. Pelto and Miller (1990) credit the AAR of 88 and MAA of 64 for the Taku Glacier’s onset of advance (circa 1900) when the remaining Juneau Icefield glaciers continued receding. This advance continued at a rate of 88 m/yr, moving 5.3 km from the 1900 minimum until 1948, all the while building and riding up on a substantial outwash plain beneath its calving face. After 1948, the now non-calving Taku Glacier, possessed AAR and MAA only slightly reduced (86 and 63), which forced 1.5 km of further advance at a reduced rate of 37 m/yr. In 1990 the Taku Glacier’s AAR and MAA were still strong enough (82 and 62) for Pelto and Miller to conclude that the Taku Glacier would continue to advance for the remaining decade of the 20th century.. They further concluded that the reduction in rate of advance is attributable to the laterally expanding terminal lobe as opposed to declining mass balance and that the primary force behind the Taku Glacier’s advance since about 1900 is due to positive mass balance.
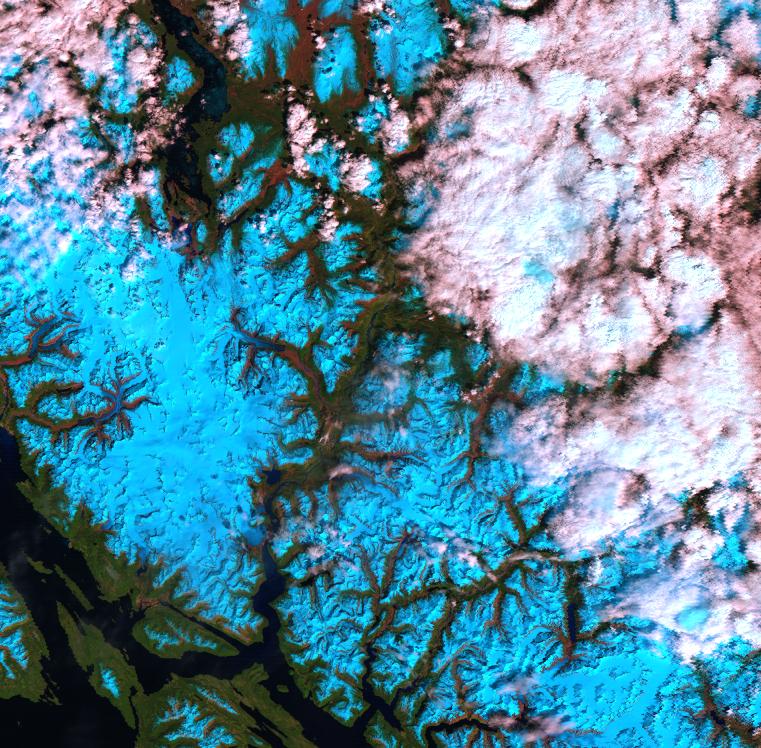
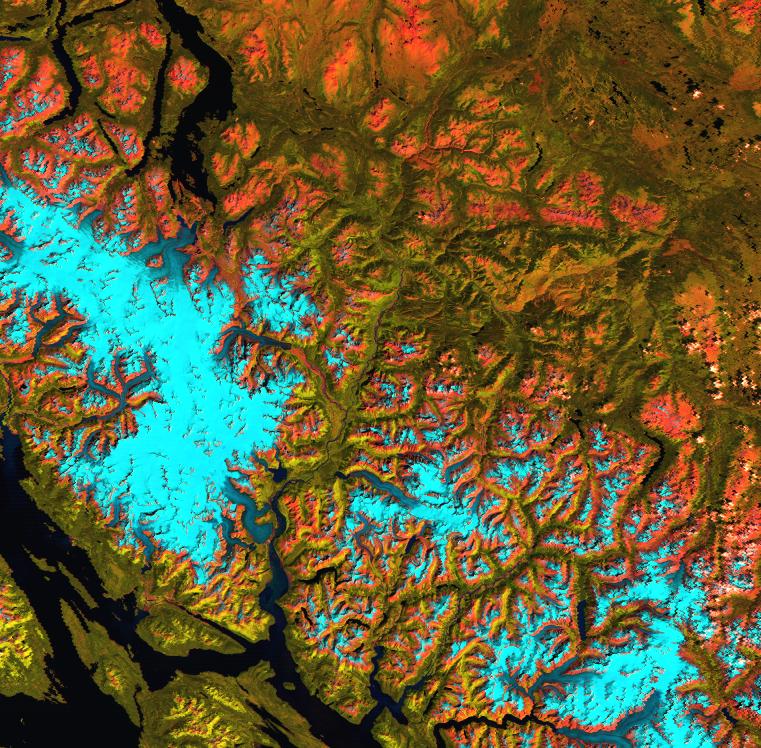
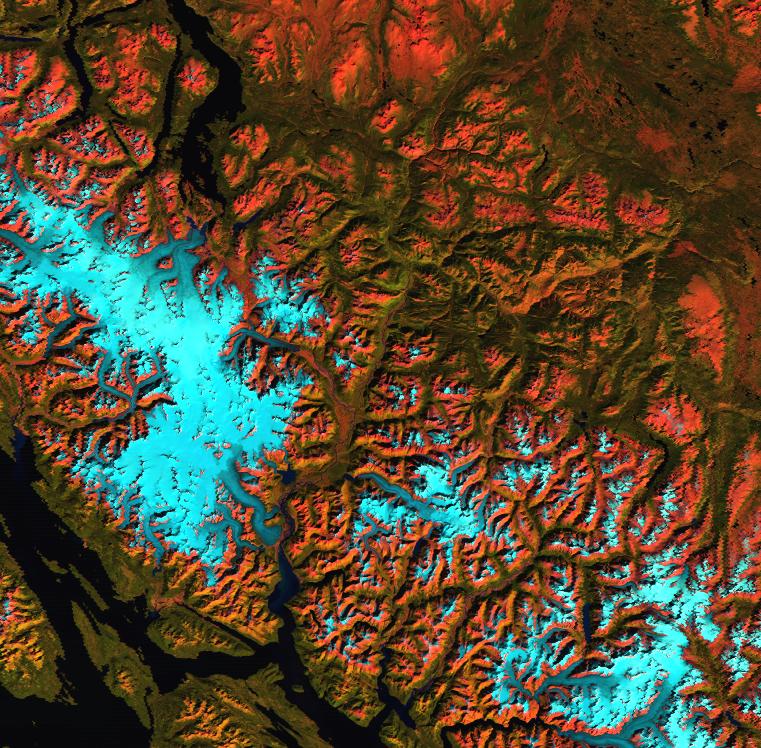
For the Lemon Creek and Taku Glaciers, assessment of accumulation, ablation, and ELA is carried out during the field season between June and September. Unfortunately the timing of the annual JIRP field season constrains the timing of field assessment of retained accumulation and total ablation. Thus, methods of extrapolation to the end of the balance year must be employed. Extrapolation introduces unfortunate error, however these errors have been mitigated to the greatest extent and geodetic methods of obtaining mass balance have validated the accuracy of the field methods. The assessment of mass balance is accurate for 11 months of the balance year, only the 12th month requires extrapolation. These errors and validation are discussed in detail below. Below are three Landsat satellite images from May 26, July 29 and Sept. 15 2006 indicating the rise of the ELA during the course of the melt season, from 1200 to 2600 to 3200 feet.
Measurement of retained accumulation is conducted via test pits, crevasse stratigraphy, and probing. Test pits are dug annually in the same location. Such sites are chosen to maximize representation of the greater area/elevation band in which they are placed, by being located in the center of glaciers and on as flat of terrain as possible in order to minimize the effects from wind and avalanche deposition. Test pits are dug down to the previous years surface, which is defined by passive means such as a characteristic undulating dirty layer, persistent density change, or a definitive depth hoar layer, or a combination of such features (Miller, 1955). Once a test pit is dug, assessment of retained snow water equivalence (SWE) is determined through snow density and ice layer measurements. Crevasse stratigraphy and probing techniques have been used in many years to validate test pit representation of a broader area. Extrapolation to the end of the ablation season from the time of test pit digging is done through ablation measurements in the accumulation zone as well as migration of the transient snow line and final position of the ELA, which is observed (usually by air) as close to the end of the balance year as possible. Accumulation zone ablation is measured annually via stakes drilled and/or pounded into the snow surface. Wooden stakes are used to minimize migration of the stake (up or down) within the snow pack (Østrem and Brugman, 1992). Initial and subsequent measurements from the top of the stake to the snow surface yields average daily rates of ablation.
Assessment of mass loss from the ablation zone has been carried out periodically by arrays of ablation stakes drilled into the ice surface, and measured as described for the ablation zone above. Unfortunately, JIRP logistical constraints have resulted in infrequent measurements in the ablation zones. Ablation rates from studies conducted in about 20% of field seasons are applied to years lacking measurements. This is another key source of error in these two records, which must be kept in mind, and hopefully remedied in the future.
Measured accumulation and ablation rates (extrapolated to the end of the balance year) are compiled in a mass balance gradient of losses and gains to the glacier with respect to elevation. Integration of losses and gains with area/elevation bands yields the total loss or gain from the glacier. This total net loss or gain is then divided by the total surface of the glacier to obtain a net mass balance that is independent of glacier size and therefore can be compared with other glaciers. These general methods are employed to obtain the mass balance time series’ for the Lemon Creek and Taku Glaciers.
Taku Glacier mass balance measurements are similar to those used on the Lemon Creek Glacier. The primary difference between the two is the much larger extent of the Taku Glacier (671 km2). On the Taku Glacier JIRP digs 18 test pits at fixed sites, monitors the migration of the transient snow line, and locates the final ELA position at the end of the balance year (Pelto and Miller, 1990). Probing snow depth in order to validate test pits has not been carried out as extensively on the Taku Glacier, primarily due to the presence of ice layers in the snow pack, as well as the great depth of accumulation at the upper elevations. However, in recent years, probing profiles totaling up to 100 points have been conducted in the area of the ELA. As on the Lemon Creek Glacier, these measurements of retained accumulation are taken during July and must be adjusted to end of the balance year values. This is once gain done via daily ablation rates derived through stake measurements and migration of the transient snow line.
Aside from the size differential between the Lemon Creek and Taku Glaciers, the only difference is the greater error in mass balance measurement from not accounting for internal accumulation on the Taku Glacier. As a very large portion of the Taku Glacier is above the ELA, and a great deal of this area is at significantly higher elevations than the Lemon Creek Glacier, much of the surface melt refreezes within the Taku Glacier and does not result in ablation. However, only very few mass balance studies incorporate quantification of internal accumulation, with most studies assuming that internal accumulation is negligible (Kaser and other, 2002).
Another possible source of error is the assumption that the density measured at test pits is representative of a larger area. However, a study at 40 points within 1 km2 at different elevations in different years resulted in a standard deviation of ±0.07 m w.e. in a snow pack of 1 to 2 m, displaying the highly uniform density of snow on the Taku Glacier (Pelto and Miller, 1990).
Possible errors for the Taku Glacier mass balance record including sparse density of measurement points (1 per 13 km2), extrapolation to the end of the balance year, infrequent measurements of melting in the ablation zone, and measurements carried out by many different investigators. However, Pelto and Miller (1990), suggest that these sources of error are mitigated by annual (since 1946) measurements at 18 fixed locations, the use of nine years of ablation data to extrapolate melt in the ablation zone, the use of a balance gradient derived from the 18 fixed sites and known values for the ablation zone that shifts in altitude from year to year based on the ELA, and through supervision of field work by at least one experienced researcher.
Recent, differential GPS measurements of a profile near the mean ELA of the Taku Glacier show a strong correlation with annual mass balance measurements. This would be expected as elevation at the mean ELA is likely to rise with increased accumulation during years of positive mass balance, and fall with increased ablation during years of negative mass balance. For the period 1993 to 2004, correlation between the average of a 31-point profile across the Taku Glacier and net mass balance is 0.77 (95% significance). This provides independent validation for Taku Glacier record.
References
Daellenbach, K. and W. Welsch. 1993. Determination of Surface Velocities, Strain
Rates, and Mass Flow Rates on the Taku Glacier, Juneau Icefield, Alaska. Zeitschrift fur
Gletscherkunde und Glazialgeologie, Band 26, Heft 2, p. 169-177.
Dobrin, M.B. 1960. Introduction to Geophysical Prospecting, 3rd
Edition, McGraw-Hill, New York, p201-254, 630 pages.
Dyugerov, M.B. and M.F. Meier, 1997. Year to year fluctuations of global mass balance of small glaciers and their contributions to sea level. Arctic and Alpine Res., 29: 392-402.
Echelmeyer, K., M. Nolan, R. Motyka, and D. Trabant. 1995. Ice thickness
Measurements of Taku Glacier, Alaska, USA, and their Relevance to it Recent
Behavior. Journal of Glaciology, Vol. 41, No. 139. Cambridge, England; p. 541-552.
Lang, M. 1997. Geodetic Activities of the 1997 Juneau Icefield Research Program Field
Season. Open File Survey Report. Juneau Icefield Research Program, Foundation for
Glacier and Environmental Research, Moscow, Idaho. 110 pp.
McGee, S. 1996. Geodetic Activities of the 1996 Juneau Icefield Research Program
Field Season. Open File Survey Report. Juneau Icefield Research Program, Foundation for
Glacier and Environmental Research, Moscow, Idaho. 79 pp.
McGee, S. 1998. Geodetic Activities of the 1998 Juneau Icefield Research Program
Field Season. Open File Survey Report. Juneau Icefield Research Program, Foundation for
Glacier and Environmental Research, Moscow, Idaho.
McGee, S. 2000. Juneau Icefield GPS Movement Profile Coordinates. JIRP Open File
Survey Report. Juneau Icefield Research Program, Foundation for Glacier and
Environmental Research. Moscow, Idaho. September, 2000. 54 pp.
Miller, M.M. 1963. Taku Glacier evaluation report. State of Alaska, Dept. of Highways and Bureau of Public Roads, U.S. Dept. of Commerce.
Miller, M. M. 1997. The Juneau Icefield Research Program and its Surveying
Mission. In: Geodetic Activities Juneau Icefield, Alaska 1981-1996. Schriftenreihe des
Studiengangs Vermessungswesen, Universität der Bundeswehr München, Heft 50. p 45.
Miller, M.M. and M.S. Pelto. 1999. Mass Balance measurements on the Lemon
Creek Glacier, Juneau Icefield, Ak 1953-1998. Geogr. Ann. 81A, 671-681.
Nye, J.F. 1965. The flow of a g;acoer om a cjamme; pf rectangular, elliptic or parabolic cross section. J. Glaciol., 5(41) 661-690.
Pelto, M. and M.M. Miller. 1990. Mass Balance of the Taku Glacier, Alaska from 1946
to 1986. Northwest Science. Vol. 64, No.3, p. 121-130.
Post A. and R.J. Motyka, 1995. Taku and Le Conte Glaciers, Alaska: Calving speed control of late-Holocene asynchrounous advances and retreats. Phys. Geogr., 16; 59-82.
Poulter, Thomas (1950) The Poulter Seismic Method of Geophysical Exploration.
Geophysics, Vol. 15, No. 2, p. 181-207.
Ramage, J.M., B.L. Isacks, and M.M. Miller. 2000. Radar Glacier zones in southeast
Alaska, U.S.A.:field and satellite observations. J. Glaciol. 46(153), 287-296.
Sprenke, K.F., M.M. Miller, F.McDonald, C. Haagen, G. Adema, M. Kelly,
S. Barbour, and B. Caceres. 1997. Geophysical investigation of the
Taku-Llewellyn Divide: A NASA Earth Systems Field Research Project, Juneau
Icefield, Alaska. Juneau Icefield Research Program Geophysics Open File
Report 97-1. (Moscow, Idaho: Glaciological and Arctic Science Institute,
University of Idaho).