Summer Snowpack Variations with Altitude on Mount Baker, Washington, 1990–1999: Comparison with Record 1998/1999 Snowfall
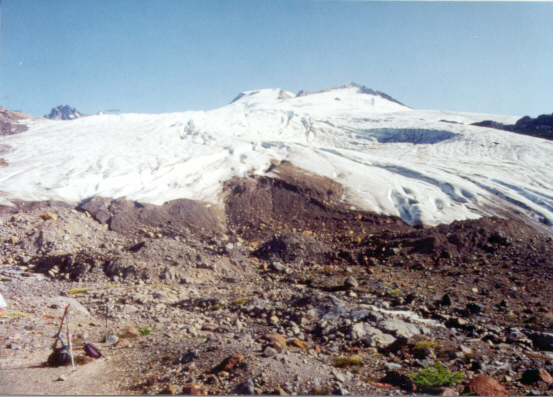
Easton Glacier in early August 1998
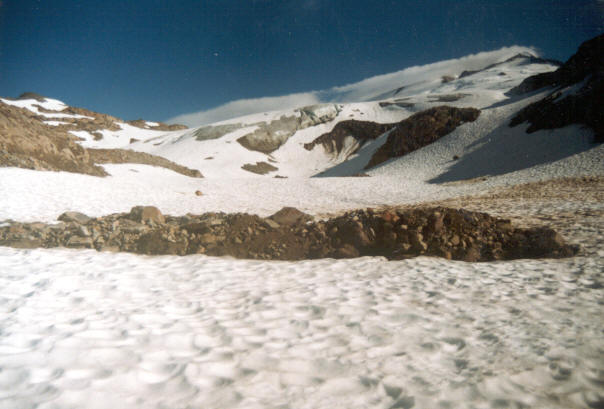
Easton Glacier in early August 1999
Abstract
During the 1998/99 winter season, Mount Baker, Washington, set a single season world snowfall record of 28.70 m, at the 1300-m measurement station. Measurements at higher elevation on two Mount Baker glaciers have been completed each year since 1990. In June, stakes were placed in each glacier to record snowpack ablation. By late August the stakes had each recorded 3.85–4.00 m of ablation. Measurement of snowpack thickness in numerous crevasses on Easton Glacier in late August 1999 indicated that 9.45 m of snowpack remained at 2150 m and 10.65 m at 2450 m. This is in sharp contrast to 1998 when snowpack was 1.55 m at 2150 m and 3.35 m at 2450. On Easton Glacier at each altitude the 1998/99 snowpack depth was more than 28% greater than any of the previous years. On Rainbow Glacier, 1999 stands out as exceptional with an August snowpack depth of 8.2, 24% greater than any other year from 1984 to 1999. The snowpack in late August had a density of 0.60 g/cm3; this is four times the normal new-fallen snow density. The sum of the observed August snowpack SWE (8.2 m) and June–August (3.8 m) ablation indicates that 1998/99 total winter snowfall at 1900 m on Rainbow Glacier was 47–49 m. This record season was most noticeable in the northern section of the North Cascades. Paradise on Mount Rainier exceeded 1000 inches for the winter season for the fifth time since 1920, but fell 72 inches short of the 1971/72 record snowfall. Snowpack measurements at USDA snotel stations at Lyman Lake and Stevens Pass did not reach record depths in 1999.
Introduction
During the 1998/99 winter season Mt. Baker, Washington set a single season world snowfall record of 28.70 m, at the 1300 m measurement station. How much snow fell at higher elevations and how did this exceptional snowfall compare to recent years?
Mt. Baker is a stratovolcano and is the highest summit in the North Cascades at 3285 m. This volcano is host to 11 substantial glaciers with an area of 37.4 km2. The Mt. Baker ski area is the site of a snow measurement station, which is located 11 km to the east of Mt. Baker. This snow measurement station has an average annual snowfall of 13.7 m. This station typically loses its snow cover in July.
From 1984 to 1999 annual snowpack measurements have been completed on Mt. Baker. From 1984 to 1990 snowpack measurements were completed only in mid-August and late September from 1500 to 2100 m on Rainbow Glacier. From 1990 to 1999 snowpack measurements have been completed in early June, in mid-August, and late September between 1500 m and 2100 m on Rainbow Glacier, and between 1500 m and 2800 m on Easton Glacier. The observed snowpack at the higher elevation glacier locations always exceeds the depth reached at the 1300 m snow measurement station. These measurements are part of the North Cascade Glacier Climate Project’s annual glacier mass balance program.
Methods
Measurement of accumulation in the accumulation area has been accomplished using probing and crevasse stratigraphy (Pelto, 1996). Probing has proved both successful and easy to use in most temperate and subpolar climate settings (Ostrem and Bruggman, 1991). LaChapelle (1954) noted that a maritime snow cover surface develops after its first year a marked increase in ram resistance caused by repeated refreezing. It is this hardness discontinuity that allows programs to utilize probing for accumulation layer thickness determination. In the North Cascades, all summers are notably warm resulting in a 2–5 cm thick band of continuous readily identifiable dirty-firn that resists penetration.
It has been noted by several investigators that superimposed ice is not found on North Cascade glaciers and that ice lenses within the annual snowpack are rare (Pelto, 1996). Since North Cascade glaciers rarely have ice lenses, an indicator of little internal accumulation, probing is an accurate method of measuring accumulation layer thickness. The probe is driven through the snowpack until the previous ablation surface is reached. The probing instrument is a 1/2 inch diameter solid stainless steel rod with 0.1 foot depth increments inscribed. Probing, though rapid in snow depths of less than 2.5 m in mid and late summer has proved difficult at greater depths than 3.5 m (Pelto, 1996). Fortunately depths of more than 3.5 m late in the summer typically occur in areas of significant crevassing on the glaciers that NCGCP observes, possibly due to the more rapid motion that the thick accumulation promotes.
Crevasse stratigraphic measurements are conducted only in vertically walled crevasses with distinguishable annual layer dirt bands. Most of the vertically walled crevasses also tend to be narrow less than 1 m across. In the North Cascades the ablation surface of the previous year is always marked by a 2- to 5-cm-thick band of dirty-firn or glacier ice.
The accuracy of crevasse stratigraphy and probing measurements are cross-checked on at least 25% of the accumulation area of each glacier where probing is used between crevasses. This cross-checking identifies measurement points that either represent an ice lens and not the previous summer surface in the case of probing, or areas where crevasses do not yield representative accumulation depth in the case of crevasse stratigraphy. In 1998, 1100 probing measurements were completed in the North Cascades, 380 were within 20 m of a crevasse, 368 of these yielded a depth within 5 cm of the nearest crevasse stratigraphic measure. If a disparity is noted further point measurements are made in the immediate vicinity to determine the, which method is yielding a false reading or if the depth is simply quite variable.
The standard deviation in snow depth obtained in cross checking and duplicate measurements are smallest for crevasse stratigraphy, +0.02 m, and +0.03 m for probing. The narrow range of deviation in vertically walled crevasses indicates that they do yield consistent and representative accumulation depths late in the summer.
Crevasses have long been avoided in mass balance measurements because of the dangers they present, despite the ease with which the annual layer can be measured. Meier and others (1997) questioned the accuracy of crevasse stratigraphic measurements.. Probing, coring and snowpits are artificial incisions into the glacier to identify the annual layer. There is no reason that a natural incision provided by a vertically walled crevasse, which intersects the same annual layer would be any less reliable (Pelto, 1997). In fact, in extensive NCGCP tests (Pelto, 1996), crevasse measurements had a lower standard measurement error in duplicate measurements. This is expected given the two dimensional view of crevasse stratigraphy versus a single dimension in snowpits and probing. In ice sheet areas distant from a dust source this maybe difficult, but on alpine glaciers mountaineers and glaciologists have long noticed the ubiquitous nature of these layers (Post and LaChapelle, 1962).
It is possible that the annual layer is difficult to distinguish in a crevasse, because of a poorly developed summer icy-dirty layer. This difficulty is even more apparent in snowpits and cores, where the view of the previous summer surface is much more limited. The lack of dirt layers in crevasses is rare in the North Cascades and many other regions. Only vertically walled crevasses that yield readily identifiable annual layers where the annual layer is not distorted by a slump into the crevasse can be utilized.
In June a total of six to 10 accumulation measurements are completed on the Easton and Rainbow Glacier. The density of accumulation measurements is greatest for the August measurement period when 150–200 measurements are made on the Easton Glacier and Rainbow Glacier, generating the most detailed map of accumulation variations across the glacier. The difficulty is assessing the maximum snow water equivalent that typically occurs in mid to late May above 1500 m on North Cascade glaciers (Pelto, 1996; 1998). Because of the exceptional snow depths typically greater than 12 m, and the high avalanche danger it is not judicious to make extensive snowpack measurements in May. Our measurements made in early June are used as a minimum of measurement of winter accumulation. To determine the change in snowpack water equivalent from the spring maximum to mid-August and hence, calculate winter snowfall, wooden stakes are emplaced into the snowpack to record ablation.
Ablation measurements are made at a minimum of six stakes on each glacier. The stakes are reset at each observation. The stakes are emplaced in early June and measurements are made in late July and early August, recording the ablation during the first three months of the ablation season, for water resource assessment purposes and resetting of the stakes when necessary. Ablation measurements are repeated in late September at the designated conclusion of the hydrologic year.
The combination of the ablation measurements and a comparison of the early June and mid-August accumulation measurements provides two measures of the snowpack depth changes prior to the extensive mid-August measurements. The one factor remaining to be considered is the compaction of the snowpack and the consequent increase in density. The density of North Cascade glacier snowpack has been found to be essentially to within the range of accuracy of the measurement instruments (0.58–0.60 g/cm3) constant by August and density measurements are only completed during June measurements (Pelto, 1996; Krimmel, 1999). Density has varied from 0.50 to 0.55 g/cm3 in June on Easton and Rainbow Glacier. This fits well the observations of density of South Cascade Glacier, which for early June of 1993 –1998 yielded a density range of 0.51–0.55 g/cm3 (Krimmel, 1998). For both the June and August measurements we then calculate snow water equivalent.
Snow water equivalent is the important value for water resource and glacier mass balance purposes; however, in this instance we are also interested in total winter snowfall. The average density of new snowfall at Paradise, Mt. Rainier is Washington at 1650 m is 0.13–0.15 g/cm3. The snowpack depth measured in June and August when the density exceeds 0.5 g/cm3 then represents a minimum snowfall of three times the observed snowpack depth. The dividend, of the sum of observed snow water equivalent (AC) and observed snow water equivalent ablation (AB), and the mean winter snowfall density of 0.15 g/cm3 (p) yields the actual total winter snowfall (S).
S = AC+AB/p
Results
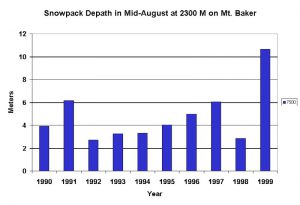
Figure 1. Snowpack depth at 2300 m on Easton Glacier each August.[/caption]
In early June 1999 snowpack depths were too large for safe measurement of depth at more than three locations. A series of 6-m-long stakes were driven into the snowpack from 1950 m to 2300 m. By late August the stakes from 2100 m to 2300 m had each recorded 3.85. Snowpack variation on Rainbow Glacier at 1900 m, as measured each August. Measurement of snowpack thickness in numerous crevasses on Easton Glacier in late August 1999 indicated that 9.45 m of snowpack remained at 2150 m and 10.65 m at 2450. This is in sharp contrast to 1998 when snowpack was 1.55 m at 2150 m and 3.35 m at 2450 m (Fig. 1). At the end of September, and the 1999 annual melt season (May–September), the snowpack at 2450 m was 7.45 m. Given the thickness of this glacier is 75–100 m (Harper, 1993), this one seasons snowfall represents 7–10% of the entire glacier thickness.
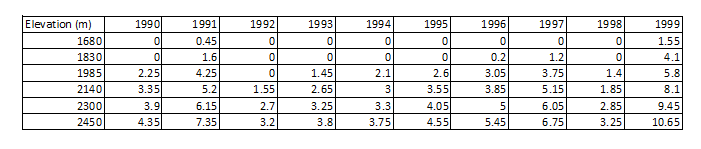
Table 1 indicates the specific observed accumulation at various altitudes on Easton Glacier from 1990–1999. At each altitude the 1998/99 snowpack depth was more than 28% greater than any of the previous years. Snowpack depth was inconsistent and did not appreciably increase from the 2450 m value at altitudes between 2500 and 2800 m.
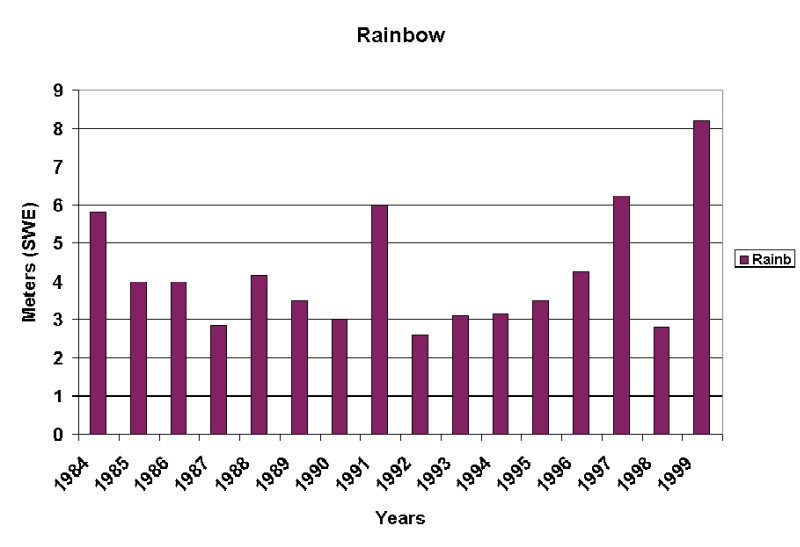
On Rainbow Glacier maximum snowpack depths are typically observed at 1900 m. Figure 2 indicates the observed mid-August snowpack depths at this elevation for the 1984–1999 period. Again 1999 stands out as exceptional with a depth of 8.2 m (Fig. 2). Avalanche danger onto this glacier, which occupies Avalanche Gorge prevented any June snowpack measurements in 1999. Ablation stakes were emplaced on the north margin of the glacier in early June. The observed ablation from June–August was 3.80 m in 1999.
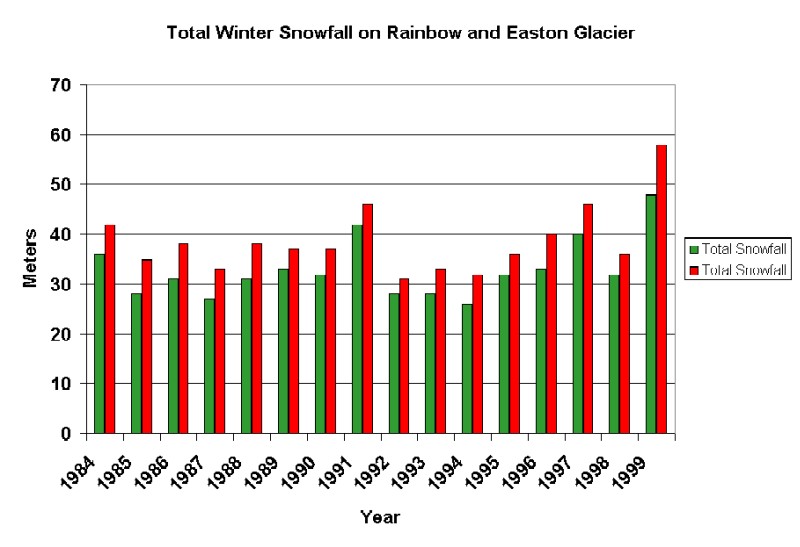
How much initial snowfall does this remaining summer snow on Easton and Rainbow Glacier represent? The snowpack in late August had a density of 0.60 g/cm3, this is four times the normal new fallen snow density. Thus, at a minimum at 2450 m the 10.65 m of snow remaining represented 42–43 m of snow compressed by time, melting and refreezing (Fig. 3). Ablation from early June to late August 3.95 m of dense snowpack indicates an additional 15–16 m of snowfall, depending on the degree of compaction of snowfall that had melted prior to our late August measurement. The minimum total snowfall for 1998/99 was then 57–59 m at 2450 m on Easton Glacier, Mt. Baker. The sum of the observed August snowpack SWE (8.2 m) and June–August (3.8 m) ablation indicates that 1998/99 total winter snowfall at 1900 m on Rainbow Glacier was 47–49 m.
How localized was this high snowfall season? Paradise on Mt. Rainier exceeded 1000 inches for the winter season for the fifth time since 1920, but fell 72 inches short of the record snowfall of 1972/73. Snowpack measurements at USDA snotel stations at Lyman Lake and Stevens Pass did not reach record depths in 1999. However, in both cases the snowpack endured longer then any other season since these measurements began in 1981. Thus, we have a combination of record snowfall and slow spring melt yielding record summer snowpack, even more exceptional than the actual winter snowpack.
References
Harper, J.T. 1993. Glacier terminus fluctuations on Mt. Baker, Washington, USA, 1940–1980, and climate variations. Arctic and Alpine Res, 25, 332–340.
Krimmel, R.M. 1995. Water, Ice and Meteorological Measurements at South Cascade Glacier, Washington, 1994 Balance Year. USGS WRI-95-4162.
Krimmel, R.M. 1998. Water, ice and meteorological measurements at South Cascade Glacier, Washington, 1997 Balance Year. USGS WRI-98-4090.
LaChapelle, E. 1954. Snow Studies on the Juneau Icefield. Am. Geogr. Soc., Juneau Icefield Research Project Report no. 9.
Meier, M.F., Armstrong, R.A., and Dyugerov, M.B. 1997: Comments on “Annual net balance of North Cascade glaciers 1984–1994” by Mauri S. Pelto. J of Glaciol., 43 (143): 192–193.
Ostrem, G. and Bruggman, M. 1991: Glacier Mass-Balance Measurements. Canadian NHRI Science Rep. no. 4.
Pelto, M.S. 1993. Current behavior of glaciers in the North Cascades and its effect on regional water supply. Washington Geology, 21(2): 3–10.
Pelto, M.S. 1996. Annual balance of North Cascade glaciers 1984–1994. J. Glaciol., 41, 3–9.
Pelto, M.S. 1997: Reply to comments of Meier and others on “Annual net balance of North Cascade glaciers 1984–1994” by M. S. Pelto. J of Glaciol., 43(143): 193–196.
Post, A.S., and LaChapelle, E.R., 1962: Glacier Ice. The Mountaineers and University of Washington Press, Seattle, Washington.