Spatial and Temporal Variations in Annual Balance of North Cascade Glaciers, Washington 1984-2000

Abstract

 Since 1984, annual glacier mass balance measurements have been conducted on 8 glaciers by the North Cascades Glacier Climate Project (NCGCP).  Since 1993 the National Park Service (NPS) has monitored the mass balance of four glaciers, and the NCGCP on an additional two glaciers. This 14 glacier monitoring network, covering an area of 14,000km2, represents the most extensive network of mass balance measurements for alpine glaciated areas in the world.   The breadth of the record allows determination of the annual variability of annual balance from glacier to glacier, and from year to year.

Data indicate broad regional continuity in response of these glaciers to climate.  All cross correlation values between any pair of the 14 glaciers ranged from 0.80 to 0.98.  This strong degree of correlation indicates that regional climate patterns, not local microclimates, are the primary control of glacier annual balance in the North Cascades. 

Data also indicate that the annual balance trend for glaciers was strongly negative from 1984-1994 and slightly positive from 1995-2000.   Cumulative annual balance for eight glaciers between 1984-1994 is –0.39 m/a.  From 1995-2000 the cumulative annual balance of the same eight glaciers is +0.10 m/a, and +0.15 m/a for all 14 glaciers in this study.

The correlation coefficients indicate the strongly similar response not that the specific magnitude of the annual balance for each glacier is the same.  There is a significant annual range in the individual glacier balances, averaging 1.01 m,  and in the mean annual balance between glaciers.   All of the glaciers with more positive annual balances since 1995 had significant accumulation area’s extending above 2390m, and or are east of the zone of maximum precipitation.  The glaciers with the most negative annual balance are those with the lowest mean elevation.  The record is as yet too short to fully explain the variability of mass balance using climate data. 

Keywords: glacier, mass balance, North Cascades, Climate Change.

Introduction

Annual mass balance is the most sensitive glacier indicator of glacier response to climate change.   Annual mass balance is the difference between winter snow and ice accumulation on a glacier, and summer snow and ice loss from a glacier during a given year.  The importance of annual glacier mass balance monitoring was recognized during the International Geophysical Year in 1957.  A series of benchmark glaciers around the world were chosen where annual mass balance would be monitored.  This network has proven valuable, though too sparse in its coverage, with just two index glaciers in the United States with ongoing measurements Lemon Creek Glacier, Alaska and South Cascade Glacier, in the North Cascades of Washington (Fountain et al., 1991).  

A glacier’s mass balance hence, its response to climate is complicated by its geographic characteristics.  No single glacier is representative of all others; thus, to understand the causes and nature of changes in glacier mass balance throughout a mountain range it is necessary to monitor a significant number of glaciers (Fountain et al., 1991).  

Currently in the United States there are four ongoing mass balance programs. 1) The USGS measures annual balance on three US glaciers Gulkana and Wolverine Glacier in Alaska, and South Cascade Glacier in Washington (Krimmel, 1999).  2) The Juneau Icefield Research Program measures annual balance on Lemon Creek Glacier, Alaska (Miller and Pelto, 1999).  3) The North Cascades National Park Service (NPS) monitors the annual balance of four glaciers in the North Cascades.  4) The North Cascade Glacier Climate Project (NCGCP) measures annual balance on ten glaciers in the North Cascades, Washington (Pelto, 1996; 1997; 2000).

This paper focuses on the latter two programs, which together provides the most extensive regional network of glacier annual balance measurements in the world.   The characteristics of the 14 selected glaciers in the NCGCP and NPS study vary considerably, and represent the range of conditions found in the North Cascades (Table 1).  This record provides an opportunity to answer several key questions:  1) How variable is annual balance from glacier to glacier? 2) What factors determine the variability from glacier to glacier?  3) What is the recent mass balance record of North Cascade glaciers? 

Glacier      Orient- Area   Accumulation    Distance       Elevation

Columbia      SSE     0.9    DS,WD, AV     15 km West   1750-1450 m       

Daniels            E       0.4    DS,WD               1 km East      2230-1970

Easton           SSE    2.9     DS                     75 km West   1700-2900

Foss               NE      0.4    DS                     At Divide        2100-1840

Ice Worm      SE      0.1    DS,AV                1 km East      2100-1900

Lower Curtis  S       0.8    DS,WD             55 km West   1850-1460

Lyman            N       0.5    DS, AV               2 km East     1850-2100

Lynch             N       0.7    DS,WD              At Divide        2200-1950

Rainbow       ENE    1.6    DS,AV              70 km West   2040-1310

Yawning         N       0.3    DS                      At Divide      2100-1880

Noisy               N      0.5    DS, WD, AV                             1850-1700

N.Klawatti       SE     1.5     DS, AV                                   2315-1820 

Sandalee          N      0.2    DS, WD, AV                            2510-2130

Silver               N      0.5    DS, WD, AV                              2230-1965

Table 1.  The geographic characteristics of the fourteen  glaciers where annual balance has been monitored annually.  Accumulation sources:  wind drifting = WD, avalanche accumulation = AV, direct snowfall = DS.

There are approximately 750 glaciers in the North Cascades (Post et al 1971).  These glaciers are vital for regional water resources (Tangborn, 1980; Pelto, 1993).  Thus, measurement of mass balance is of more than academic interest.  The study interval 1984-2000 began in a period of negative glacier mass balance, extending that dominated the 1975-1994 interval (Pelto, 1996; Krimmel, 1994).   The latter portion of the study period 1995-2000 has been more favorable but very inconsistent and cannot yet be identified as a period of more favorable mass balance.

Methods

Annual mass balance changes can only be accurately assessed through field measurement, this has been the goal of the NPS and NCGCP programs.  Mayo (1972) estimates that surface measurements on temperate glaciers can account for approximately 95% of annual changes in glacier mass.   Long term changes in mass balance, which can verify the accuracy of the annual balance measurements can be made using geodetic methods, such as airborne surface profiling or surface remapping.  Glacier balance data is collected with somewhat different approaches by the NCGCP and NPS programs.   Despite the different approaches, however, we are confident that data collected by the two programs can be compared at the end of the water year. 

NCGCP measures the change in snow, firn and ice storage between fixed dates to and t1 at the end of consecutive hydrologic years.  The fixed dates are in the last 10 days of September.  This is known as annual balance ba (Mayo et al., 1972; Pelto, 1997).    The NPS measures the change in annual balance from one balance minimum to the next, this does not occur on a consistent date.  This is the net balance bn for the glacier (Mayo et., 1972).  The balance minimum in the North Cascades identified by the NPS varies from Late September to the start of October, not on a fixed date. The only difference between the end result of the annual measurement programs is the difference in timing between the fixed date method and the end of the hydrologic year method.   In this instance the timing of the measurements is a 5-10 day difference at the end of the water year, a period of minimal ablation, 0.01 m/day.  Any accumulation during this interval is measured during the next year’s accumulation measurements by both programs.   Thus, the annual balance and net balance are for practical purposes synonymous in these two studies and can be directly compared. The appropriateness of this direct comparison data is supported by the high cross correlation values observed between all of the glaciers, which range from 0.80 – 0.98.

The other primary difference is that summer and winter balance are not separately determined by NCGCP, though summer balance is measured. Winter balance is not measured by NCGCP because of the avalanche danger in monitoring so many glaciers.   Both the NPS and NCGCP methods emphasize a relatively high density of measurements, consistent measurement methods at fixed locations and on fixed dates annually (Table 1).  Glaciers monitored in both programs do not lose significant mass by calving or avalanching, so that changes observed are primarily a function of winter accumulation and summer ablation on the glacier’s surface. Glaciers monitored in both programs also have relatively simple shapes, without multiple accumulation areas and ice divides.

NCGCP Program

Since 1984, NCGCP has monitored the annual balance of 8 glaciers, and since 1994 on two additional glaciers (Pelto, 1996 and 1997). Measurements are made at the same time each year in early summer, late July and again in late September near the end of the ablation season.   Any additional ablation that occurs after the last measurement is measured during the subsequent hydrologic year.  

The average density of measurements by the NCGCP in the accumulation zone of each glacier ranges from 180-300 points km (Pelto, 1996; 2000).   Measurement of accumulation is accomplished using probing and crevasse stratigraphy.  Probing has proved successful in most temperate glaciers (Ostrem and Bruggman, 1991).  LaChapelle (1954) noted that a dense snow-cover surface develops during the first summer snow covers a glacier due to repeated surface refreezing.  This results in a marked increase in probe ram resistance, which allows for determination of the thickness of the previous winter snowpack.   Crevasses also provide an opportunity to assess accumulation as a natural incision that provides a vertical view of snowpack thickness.  Crevasse stratigraphic measurements are conducted only in vertically walled crevasses with distinguishable annual layer dirt bands.  In extensive tests, NCGCP found crevasse measurements had a lower standard error in duplicate measurements than probing (Pelto, 1996, 1997). 

In the North Cascades at the end of summer, the density of the previous winter’s snowpack that remains on a glacier is remarkably consistent (Pelto, 1996; Krimmel, 1998).  NCGCP dug more than 100 snow pits to measure bulk density between 1984 and 1986, and found that it ranged from 0.59-0.63 Mg/m3.  Due to this consistency, snow pits are no longer used, and bulk density at the end of the ablation season is assumed to be 0.60 Mg/m3.

In the ablation zone, ablation stakes are emplaced in a sequence from areas that lose their snowcover early in the summer to those that lose it late in the summer and not at all.  Ablation measurements are made at a minimum of six stakes on each glacier 20-50 points km2.  Measurements are made in late July and early August, recording the ablation during the first three months of the ablation season, for water resource assessment purposes and redrilling of the stakes when necessary.  Ablation measurements are repeated in late September at the designated conclusion of the hydrologic year.

The use of a high measurement density and consistent methods provides that errors resulting from an imperfectly representative measurement network are largely consistent and correctable (Pelto, 1996, 1997, 2000).

National Park Service Program

Since 1993, the NPS has monitored the net balance of three glaciers, and a fourth glacier since 1994.  Methods generally follow those established by the USGS during 45 years of monitoring South Cascade Glacier (Krimmel, 1994).   These methods employ a two-season stratigraphic approach to calculate mass gained (accumulation) and mass lost (ablation) on a seasonal basis.  Summation of these measurements allows for calculating the net balance of a given glacier for a given hydrologic year. 

Measurements of accumulation are made in late April-early May as conditions allow. 

Thickness of the previous winter’s snowpack is measured using probes at various points on the glacier.  Measurement density ranges from 40 points/km2 on North Klawatti Glacier to 100 points/km2 on Noisy Glacier. Density of the snowpack at this time of year is assumed to be 0.5 Mg/m3.  Actual bulk density, measured annually on South Cascade Glacier, and from 1993-1995 on other glaciers,  support this assumption.

Measurements of ablation are made in mid-summer and in late September-early October on each glacier.   Ablation stakes are used to measure the amount of firn and ice lost beneath the previous winter’s snowpack.  At least four stakes are placed on a longitudinal profile at fixed locations down the centerline of each glacier.

Winter accumulation and summer ablation balance maps are constructed annually for each glacier using large scale digital elevation models for each glacier.  Data from point measurements are used to develop mathematical relationships between accumulation and ablation and elevation.  These relationships are then used to integrate point data across the entire surface of the glacier within each 10m contour.  Net balance for a given year is then determined by summing the values for each 10m contour for the entire glacier surface.

In an examination of the error in mass balance measurements using different sampling densities, it was noted on the Columbia Glacier that the total number of measurements necessary to achieve consistent accuracy within +0.10 was 40 points (Pelto, 2000).   Both NCGCP and NPS rely on a higher number of measurements.  The results confirm Fountain and Vecchia (1999) conclusion that the number of measurements necessary to determine mass balance on small alpine glaciers is scale invariant, in this case that 40 points satisfactorily minimized errors on both glaciers.  This is a higher than typical measurment density for annual balance assessment, and allows for avoiding the use of statistical tests that are applied to compensate for lower measurement densities (Pelto, 2000). 

Annual Balance Record

The net balance record and annual balance record is shown in Table 2 and Figure 2.  The emphasis of Figure 2 is to illustrate the parallel nature of the trendlines for annual balance and net balance (annual balance) for each glacier indicating the degree of similarity in annual response, which makes it difficult to distinguish the balance record of a single glacier.  There is a significant range in annual balance from the most positive to most negative for each year, the mean for the period is 1.01 m/a.  The standard deviation of annual balance for the glacier group within each year averages 0.38 m/a.  The standard deviation of annual balance and net balance for individual years from 1995-2000 for all fourteen glaciers ranged from 0.24 in 1997 to + 0.48 in 1998.  The standard deviation is highest in years with higher negative balances. 

The annual balance record of North Cascade glaciers indicates a significant negative balance from 1984-1994 on all nine glaciers observed annually during this entire interval, -0.39 m/a for an average loss in mean glacier thickness of 4-4.5 m.   The mean annual balance from l995-2000 for the same eight glaciers is 0.10 m/a, and 0.15 m/a for all fourteen glaciers in this study indicating a significant change to a slightly positive annual balance regime. (Measurement sites on the right on the Lynch Glacier indicated by dots)

That the mass balance is dominated by a regional climate signal is clear in a comparison of the annual balance records from these fourteen glaciers in this study and the South Cascade Glacier (Krimmel, 1999) monitored by the USGS (Table 2 and Figure 1).   

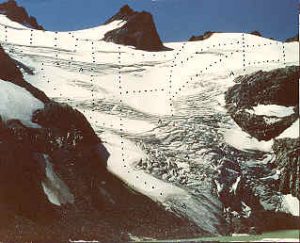
From a statistical standpoint the records of some of the glaciers are still short and the best measure of their similarity is cross correlation of annual balance between each glacier Table 4.  In most years as indicated by Figure 2 the glacier’s annual balance is similar regardless of regional setting.  The lowest correlation coefficient between glaciers in this study is 0.80, with a mean correlation coefficient of  0.91.  This demonstrates the degree to which annual balance in the North Cascades is a function of the regional climate for a given year.   If we include the South Cascade Glacier measured by the USGS, the lowest correlation is 0.79.  This glacier is retreating more rapidly than any other in the study, as a result of its generally more negative annual balance, hence its lower correlation is not a surprise. 

Figure 3a and 3b show respectively, the long-term cumulative balance of  eight NCGCP glaciers 1984-2000, and the cumulative balance of all 15 glaciers in the North Cascades (1993-2000) where mass balance measurements have been made.  The trends in Figure 3a are parallel, but represent a substantial range in the magnitude of the cumulative balance. 

Glacier

1984

1985

1986

1987

1988

1989

1990

1991

1992

1993

1994

1995

1996

1997

1998

1999

2000

Columbia

0.21

-0.31

-0.2

-0.63

0.14

-0.09

-0.06

0.38

-1.85

-0.9

-0.96

-0.45

-0.62

0.35

-1.46

1.75

0.4

Daniels

0.11

-0.51

-0.36

-0.87

-0.15

-0.37

-0.68

-0.07

-1.7

-0.83

-0.45

0.24

0.45

0.88

-1.82

1.52

-0.25

Foss

0.51

-0.69

0.12

-0.38

0.23

0.09

-0.27

0.3

-1.92

-0.73

-0.68

0.31

0.34

0.5

-1.95

1.56

-0.1

Ice Worm

0.86

-0.75

-0.45

-1.39

-0.24

-0.67

-0.92

0.63

-2.23

-1.02

-1.23

0.47

0.57

0.76

-1.64

2.15

-0.33

L. Curtis

0.39

-0.16

-0.22

-0.56

-0.06

-0.29

-0.51

0.04

-1.76

-0.48

-0.55

-0.21

-0.18

0.27

-1.38

1.55

-0.25

Lynch

0.33

-0.22

-0.07

-0.3

0.17

0.03

-0.12

0.36

-1.38

-0.62

-0.4

0.18

0.53

0.62

-1.97

1.45

-0.24

Rainbow

0.58

0.04

0.2

-0.26

0.43

-0.24

-0.46

0.44

-1.65

-0.8

-0.72

-0.2

0.12

0.51

-1.49

1.84

0.15

Yawning

0.09

-0.23

-0.1

-0.47

-0.06

-0.19

-0.32

0.23

-2.06

-0.66

-0.62

-0.26

0.34

0.5

-2.03

1.63

-0.18

Easton


-0.58

0.41

-1.67

-1.01

-0.92

-0.31

0.22

0.53

-1.87

1.61

-0.1

Lyman


-0.64

-1.15

-0.53

-0.58

-0.9

0.55


-0.98

-0.71

-0.48

-0.41

0.43

-1.66

0.58

-0.28

Noisy


-0.95

-1.16

-0.11

0.22

0.1

-1.54

1.45

0.34

Sandalee


-0.19

0.37

0.81

0.87

-1.1

1.45

0.7

Silver


-0.04

-0.11

0.46

0.87

0.63

-0.07

1.49

1.01

N. Klawatti


-1.09

-1.93

-0.47

0.33

0.88

-1.49

1.57

0.8

S. Cascade

0.12

-1.2

-0.71

-2.56

-1.64

-0.71

-0.73

-0.2

-2.01

-1.23

-1.02

-0.69

0.1

0.63

-1.8

1.02


Table 2.  The annual balance of 14 North Cascade glaciers in this study, and  the South Cascade Glacier.   The Columbia Glacier through Lyman Glacier are monitored by NCGCP.  The Noisy Glacier through N.Klawatti Glacier are monitored by the NPS The South Cascade glacier is monitored by the USGS

Figure 1. Annual balance record of North Cascade glaciers in meters of water equivalent. The high degree of correlation between glaciers is evident in the close tracking of each record
Figure 2. Cumulative annual balance of 8 North Cascade glaciers 1984-2000 above and of 14 North Cascade glaciers 1993-2000 below.

Regional Variations

The glaciers in this study can be broken into two broad regional groups based on cumulative balance and annual balance records.  In most years, the agreement between all of the glaciers is excellent.  However, in a few years such as 1995 and 1996 regional variations are evident.  In both cases glaciers further east with respect to the climate divide had more positive mass balances, Figure 4a  and 4b.

From 1985-1994 Ice Worm Glacier and Daniels Glacier had the most negative balances, both of these glaciers are on Mt. Daniels, just east of the Cascade Crest.  From 1995-2000 Columbia Glacier and Lower Curtis Glacier had the most negative balances, these being the two lowest elevation glaciers.  In Figure 3b, Silver Lake and Sandalee Glacier have had noticeably more positive balances.  The next three most positive are Lynch Glacier, Daniels Glacier and Ice Worm Glacier.  Each of these five glaciers is in the drier region of the range with annual precipitation of  150-200 cm.  The Cascade Crest and West Side glaciers all have annual precipitation exceeding 200 cm. 


Col

Dan

Foss

IW

LC

Lyn

Rain

Yawn

East

NC

SL

Sand

NK

SC

Columbia

1


Daniels

0.83

1


Foss

0.91

0.94

1


Ice Worm

0.89

0.94

0.91

1


Lower Curtis

0.93

0.92

0.94

0.92

1


Lynch

0.86

0.96

0.98

0.9

0.93

1


Rainbow

0.95

0.9

0.94

0.9

0.97

0.93

1


Yawning

0.91

0.95

0.97

0.89

0.96

0.98

0.96

1


Easton

0.93

0.96

0.97

0.96

0.95

0.97

0.99

0.98

1


Noisy Creek

0.83

0.87

0.84

0.89

0.85

0.85

0.85

0.87

0.93

1


Silver Lake

0.93

0.9

0.94

0.94

0.91

0.89

0.97

0.93

0.96

0.88

1


Sandalee

0.87

0.95

0.97

0.92

0.9

0.96

0.95

0.97

0.97

0.94

0.96

1


North Klawatti

0.9

0.8

0.85

0.88

0.82

0.8

0.92

0.84

0.9

0.8

0.98

0.9

1


South Cascade

0.89

0.81

0.83

0.86

0.81

0.79

0.9

0.84

0.9

0.85

0.94

0.9

0.95

1

Table 3 Cross Correlation of annual balance on North Cascade glaciers.  The Columbia Glacier through Lyman Glacier are monitored by NCGCP and the reported values are for ba.  The Noisy Glacier through N.Klawatti Glacier are monitored by the NPS and the reported value is the net balance, bn.  The South Cascade glacier is monitored by the USGS and is the net balance, bn.

Glaciers that are east of the precipitation divide have a less maritime climate and share a similar history.  Within the east side group Silver Glacier tends to have the highest mean annual balance and Lyman Glacier the lowest (Figure 4a).  Lyman Glacier has the lowest mean altitude of any glacier in this group.  Silver Glacier has the highest mean altitude. This group includes the glaciers of Mt. Daniels, which have a distinct record.  Mt. Daniels is on the Cascade Crest has two glaciers on either side of the crest.  These glaciers have a very similar record and as a group fit the east side pattern, better than the Cascade Crest pattern. 

The second group encompasses the more maritime or western region of the range.  This includes the large volcanoes of Mt. Baker and Glacier Peak outlying peaks east of the Cascade Crest, and glaciers along the Cascade Crest between Glacier Peak and the Skagit River.  Within this group the Lower Curtis and Columbia Glacier are low elevation, avalanche fed glaciers that are less consistent in their annual balance.  The west side glaciers had a more positive year in 1999 than the east side glaciers (Figure 4b). 

In the east side group the glacier that has the poorest fit is the lowest elevation glacier the Lyman Glacier.  In the west side glacier group the poorest fit are Columbia Glacier and Lower Curtis Glacier both low altitude glaciers.  Grouping these glaciers together not as a regional, but as a topographic group yields a good agreement.

Conclusion

All glaciers in the North Cascades of Washington have similar mass balance histories.   The mean annual range between the most positive an negative annual balance for a glacier is significant at 1.1 m, but the degree of similarity in response to annual climate conditions is even more striking as indicated by the high correlation coefficients.  There are some regional patterns evident within the range, but the dominant signal is the overall climate regime of the entire North Cascade region.  The regional signals separate the glaciers in the western (more maritime) and eastern (less maritime)

Figure 3. Cumulative annual balance of A. West region glaciers and B. East region glaciers. regions of the North Cascades. Altitude also is a key factor in determining recent mean annual balance.

How significant was the recent negative mass balances? The negative mass balance of the 1977-1994 period led to the retreat of all North Cascade glaciers observed (Krimmel, 1999; Pelto, 1993).  By 1984, all the Mount Baker glaciers, which were advancing in 1975, were again retreating (Pelto, 1993).  The mean retreat of eight Mt. Baker glaciers from 1979-1998 was 197 m.   Between 1979 and 1984, 35 of the 47 North Cascade glaciers observed annually by NCGCP had retreated.  By 1991 all 47 glaciers termini observed by NCGCP were retreating (Pelto, 1993).  As these 47 glaciers have retreated NCGCP has observed the development of nine new alpine lakes, occupying basins formerly filled by ice.  The less negative balance of the last five years have not had a substantial impact on terminus behavior yet.  With the 2000/01 winter season having the lowest snowpack at the USDA Snotel system in the North Cascades it is evident that the upcoming year will be one of negative annual balances.

An equally important conclusion is that the annual balance field methods utilized by both NPS and NCGCP though different are yielding consistent and accurate results.   This network represents an important record for understanding the long-term impact of climate change on the glaciers of the entire North Cascades. 

References

 Ebbesmeyer, C.C., D.R. Cayan, D.R. McLain, F.H. Nichols, D.H. Peterson, and K.T. 
Redmond. 1991.  1976 step in the Pacific Climate: Forty environmental changes between 1968- 1975 and 1976-1984.  In Betancourt, J.L. and Tharp, V.L., Proc. On the 7th Annual Pacific Climate Workshop, 129-141.

Fountain, A., Trabant, D., Bruggman, M., Ommaney, C. and Monroe, D.,

1991 Glacier mass balance standards.  EOS, 72(46): 511-514.

Fountain, A., and Vecchia, A.  1999.  How many stakes are required to measured

the mass balance of a glacier.  Geo. Ann. 81(A), 563-568.

Fountain, A., and Vecchia, A.  1999.  How many stakes are required to measured

the mass balance of a glacier.  Geo. Ann. 81(A), 563-568.

Krimmel, R.M., 1994.  Water, Ice and Meteorological Measurements at South

Cascade Glacier, Washington, 1993 Balance Year.  USGS WRI-94-4139.

Krimmel, R.M., 1998.  Water, Ice and Meteorological Measurements at South

Cascade Glacier, Washington, 1997 Balance Year.  USGS WRI-98-4090.

Krimmel, R.M., 1999.  Water, Ice and Meteorological Measurements at South

Cascade Glacier, Washington, 1998 Balance Year.  USGS WRI-99-4049.

LaChapelle, E.  1954. Snow Studies on the Juneau Icefield.  Am. Geogr. Soc.,

Juneau Icefield Research Project Report no. 9.

Mayo, L.R., M.F. Meier and W.V. Tangborn. 1972. A system to combine

stratigraphic and annual mass balance systems:  A contribution to the IHD. J. Glac. 11(61): 3-14.

Ostrem, G. and M. Bruggman. 1991. Glacier Mass-Balance Measurements. 

Canadian NHRI Science Rep. no. 4.

Pelto, M.S. 1993. Current behavior of glaciers in the North Cascades and its effect

on regional water supply.  Washington Geology 21(2): 3-10.

Pelto, M.S., 1996. Annual net balance of North Cascade glaciers, 1984-1994.  J.

Glaciol. 42(140): 3-9.

Pelto, M.S., 1997:  Reply to comments of Meier and others on “Annual net balance

of North Cascade glaciers 1984-1994” by M. S. Pelto.  J of Glaciol. 43(143): 193-196.

Pelto, M.S. , 2000.  The impact of sampling density on glacier mass balance determination. 

Hydrolo.Proc. 14: 3215-3225.

Pelto, M.S. and M.M. Miller. 1999.  Mass balance measurements on the Lemon Creek Glacier,

            Juneau Icefield,  Alaska.  Geografiska Annaler 81A: 671-681. 

Post, A., D. Richardson, W.V. Tangborn and F.L. Rosselot.  1971. Inventory of

glaciers in The North Cascades, Washington.  US Geological Survey Prof. Paper, 705-A.

Tangborn, W. V., 1980. Two models for estimating climate-glacier relationships in

the North Cascades, Washington, USA. J.Glaciol. 25: 3-21.