Global Retreat

Recent Global Glacier Retreat Overview

In recent years I have been asked to write the section on Glacier and Ice Sheets for the Bulletin of the American Meteorological Society Annual State of the Climate report, for example BAMS State of the Climate 2008, 2009 and 2010.  This forces me to keep up with investigations of  glacier terminus change around the globe.  This article documents some of the observations.  In historic times, glaciers grew during the Little Ice Age, a cool period from about 1550 to 1850. Subsequently, until about 1940, glaciers around the world retreated as climate warmed. Glacier recession declined and reversed, in many cases, from 1950 to 1980 as a slight global cooling occurred. Since 1980, glacier retreat has become increasingly rapid and ubiquitous, so much so that it has threatened the existence of many of the glaciers of the world [1]. This process has increased markedly since 1995, leading to such bizarre steps as covering sections of Austrian alpine glaciers with plastic to retard melting. The World Glacier Monitoring Service has noted 19  consecutive years of negative mass balances, that is volume losses.  If a business had 19 consecutive losing years they would be bankrupt.  This can lead to the disappearance of a glacier as seen below with Milk Lake Glacier and Lewis Glacier, North Cascades, Washington.  Which melted away between 1988 and 1995, creating Milk Lake.  It also raises the need to forecast survival of individual smaller alpine glaciers.  The below is a regional overview to review the retreat of individual glaciers examined one at time look at the 150 posts in the glacier change blog.

Milk Lake in 2009, the glacier now entirely gone.

Milk Lake Glacier in 1988 clinging to the slopes above the greenish lake.

Lewis Glacier in 1988 as the last relict ice is melting away.

Former Lewis Glacier basin in 2006.

The recession of mountain glaciers, has been used to provide qualitative support to the rise in global temperatures since the late 19th century. Many glaciers are being lost to melting further raising concerns about future local water resources in these glacierized areas. Glaciers are the perfect summer water supply in alpine regions providing the highest runoff during warm dry periods when other water sources are at a minimum.  The smaller the glacier area to melt, the less the runoff, the greater the change in alpine streamflow and the higher the stress on man and aquatic users of this resource.  The result of glacier loss will be reduced summer runoff providing fewer resources for hydropower in Europe, hydropower and irrigation in the Himalaya, Andes and Western North America. The Lewis Glacier, North Cascades pictured at right after melting away in 1990, reducing its August streamflow by 40%.  In the Himalaya the loss is not as great for basins where the summer monsoon is key.  These areas are naturally wet during the main melt season.

Glaciers respond to climate in an attempt to achieve equilibrium. A glacier consists of an accumulation zone where accumulation persists through the summer, and an ablation zone where snowcover is seasonal and melting dominates. To be sustained a glacier must have a consistent accumulation zone.  A glacier advances due to a climate cooling/snowfall increase that causes positive mass balance.  This advance increases the glaciers area at low elevation where ablation is highest, returning the glacier to equilibrium.  A climate warming/snowfall decrease leads to negative mass balances and glacier retreat.  To reestablish equilibrium a retreating glacier must lose enough of its highest melting (ablating) sections, usually at the lowest elevations, so that accumulation in the accumulation zone once again balances ablation, reestablishing equilibrium..  If a glacier cannot retreat to a point where equilibrium is established, it is in disequilibrium with the climate system. A glacier that is in disequilibrium with present climate will melt away with a continuation of this climate.   A glacier that is significantly thinning in the accumulation zone does not have a consistent accumulation and will disappear.  The thinning is evident by bedrock being exposed in the accumulation area and thinning of  the glacier margin in the accumulation zone.  Thus, we can have retreat at the head of the glacier not just at the terminus of the glacier.  The chart below indicates that global mass balance ( Data from World Glacier Monitoring Service is trending more negatively today even as glaciers retreat rapidly,  whether examined annually or decadally. 

Since glacier termini take a few years to respond to climate change, they will continue to retreat in the foreseeable future regardless of climate.  With a continuation of the current climate retreat will continue as the glacier mass balances indicate the glaciers are not approaching equilibrium.

For detailed analysis of over 150 individual glaciers and their retreat histories utilize Glacier Change.

Himalayas

Below is a list of individual glaciers in the Himalaya and high mountains of Central Asia that illustrate what is happening glacier by glacier. In addition to the individual sample glaciers we tie the individual glaciers to the large scale changes of approximately 10,000 glaciers that have been examined in repeat satellite image inventories. In the high mountains of Central Asia detailed glacier mapping inventories, from GLIMS: (Global Land Ice Measurements from Space), ICIMOD (International Centre for Integrated Mountain Development), ISRO ( Indian Space Research Organisation) and Chinese National Committee for International Association of Cryospheric Science (IACS) of thousands of glaciers have indicated increased strong thinning and area loss since 1990 throughout the region except the Karokoram. The inventories rely on repeat imagery from ASTER, Corona, Landsat, IKONOS and SPOT imagery. It is simply not possible to make observations on this number of glaciers in the field. In the Russian Altai mapping of 126 glaciers indicate a 19.7 % reduction in glacier area 1952-2004, with a sharp increase after 1997 (Shahgedanova et al., 2010). In Garhwal Himalaya, India, of 58 glaciers examined from 1990-2006 area loss was 6% (Bhambri et al, 2011). They also noted the number of glaciers increased from 69 (1968) to 75 (2006) due to the disintegration of ice bodies. Examination of 466 glaciers in the Chenab, Parbati and Baspa Basin, India found a 21% decline in glacier area from 1962 to 2004 (Kulkarni, 2007). Glacier fragmentation was also observed in this study, which for some fragments represents a loss of the accumulation area, which means the glacier will not survive (Pelto, 2010). The India glacier inventory (ISRO, 2010) identified glacier area losses and frontal change on 2190 glaciers and found an area loss rate of 3.3% per decade and 76% of glaciers retreating. In the Nepal Himalaya area loss of 3808 glaciers from 1963-2009 is nearly 20% (Bajracharya et al., 2011). The Langtang sub-basin is a small northeast-southwest elongated basin, tributary of Trishuli River north of Kathmandu and bordered with China to the north. The basin contained 192 km2 of glacier area in 1977, 171 km2 in 1988, 152 km2 in 2000 and 142 km2 in 2009. In 32 years from 1977 to 2009 the glacier area declined by 26% (Bajracharya et al., 2011). In the Khumbu region, Nepal volume losses increased from an average of 320 mm/yr 1962-2002 to 790 mm/yr from 2002-2007, including area losses at the highest elevation on the glaciers (Bolch et al., 2011). The high elevation loss is also noted in Tibet on Naimona’nyi Glacier which has not retained accumulation even at 6000 meters. This indicates a lack of high altitude snow-ice gain (Kehrwald et al, 2008). The Dudh Koshi basin is the largest glacierized basin in Nepal. It has 278 glaciers of which 40, amounting to 70% of the area, are valley-type. Almost all the glaciers are retreating at rates of 10–59 m/year and the rate has accelerated after 2001 (Bajracharya and Mool, 2009). In the Tien Shan Range over 1700 glaciers were examined from 1970-2000 glacier area decreased by 13%, from 2000-2007 glacier area shrank by 4% a faster rate than from 1970-2000 (Narama et al, 2010). An inventory of 308 glaciers in the Nam Co Basin, Tibet, noted an increased loss of area for the 2001-2009 period, 6% area loss (Bolch et al., 2010). Zhou et al (2009) looking at the Nianchu River basin southern Tibet found a 5% area loss. 1990-2005. Cao et al, (2010) completed an inventory of 244 glaciers in Lenglongling Range of Eastern Qilian Mountains from 1972 to 2007 and found a 23.5% loss in glacier area. The highest rate of 1% per year of area loss was identified from 2000 to 2007. In the Pumqu Basin, Tibet an inventory of 999 glacier from the 1974 & 1983 to 2001 indicated the loss of 9% of the glacier area and 10% of the glaciers disappeared (Jin et al, 2005). Pan et al (2011) looking at the Gongga Mountains, China found a 11.3% area loss from 1966-2009. In the Wakhan Corridor, Pamir Range, Afghanistan 30 glaciers were examined over a 27 year period, 1976-2003, indicating that 28 of the glacier retreated with an average retreat of 294 m, just over 10 meters/yr (Haritashya, et al., 2009). The Karokoram is the one range where a mix of expansion and retreat is seen. The anomalous expansions are confined to the highest relief glaciers and appeared suddenly and sporadically (Hewitt, 2005). After decades of decline, glaciers in the highest parts of the central Karakoram expanded, advanced, and thickened in the late 1990s. Many of the largest glaciers in the Karakoram are still retreating including the Baltoro, Panmah and Biafo Glacier, albeit slowly (Hewitt, 2011). A new means of assessing glacier volume is GRACE, which cannot look at specific changes of individual glaciers or watersheds. In the high mountains of Central Asia GRACE imagery found mass losses of -264 mm/a for the 2003-2009 period (Matsuo and Heki, 2010). This result is in relative agreement with the other satellite image assessments, but is at odds with the recent global assessment from GRACE, that estimated Himalayan glacier losses at 10% of that found in the aforementioned examples for volume loss for the 2003-2010 period (Jacobs et al, 2012). At this point the detailed glacier by glacier inventories inventories of thousands of glaciers are better validated and illustrate the widespread significant loss in glacier area and volume, though not all glaciers are retreating.

In the main Himalayan Range from India-Nepal and Sikkim the terminus behavior of 51 glaciers have been examined for the 1975-2003 period.  All 51 have retreated and continue to retreat.  In India the Gangotri Glacier retreated 34 m per year from 1975-2006.  This glaciers remains over 30 km long, and is not in danger of disappearing anytime soon.  The glacier is the largest glacier at the headwaters of the Bhagirathi River, which has the Tehri Dam a 2400 mw hydropower facility. Gangotri Glacier has retreated 1 km in the last 30 years, and with an area of 286 km2 provides up to 190 m3/second (Singh et. al., 2006).Glaciers in the Mount Everest region of the Himalayas are all in a state of retreat. The Rongbuk Glacier, draining the north side of Mount Everest into Tibet, has been retreating 20 m per year. In the Khumbu region of Nepal along the front of the main Himalaya of 15 glaciers examined from 1976-2007 all retreated significantly, average retreat was 28 m per year . The most famous of these Khumbu Glacier retreated at a rate of 18 m per year from 1976-2007 (Bajracjarya and Mool, 2009).  In India the Gangotri Glacier, retreated 34 m per year between 1970 and 1996, and has averaged a loss of 30 m  per year since 2000.   For the Indian Himalaya retreat averaged 19 meters per year for 17 glaciers all retreating. In Sikkim all 21 glaciers examined are retreating at an average rate of 20 m per year . For the 51 glaciers in the main Himalayan Range of India, Nepal and Sikkim all 51 are retreating, at an average rate of 23 m per year. The Zemu Glacier is a 26 km long glacier draining the east side of Kanchenjunga the world’s third highest mountain. Zemu Glacier has retreated 420 m from 1978-2005, a rate of 14 meters per year (Raina, 2009). The glacier acts as a natural reservoir releasing water due to melting to the Teetsa River. The Teetsa River is the focus of a hydropower development project , to date 510 mw of the proposed 3500 mw potential are operating.   In the Karokoram Range of the Himalaya there is a mix of advancing and retreating glaciers with 18 advancing and 22 retreating during the 1980-2003 period. Many of the advancing Karokoram glaciers are surging. Retreat of Reqiang Glacier seen below from 2000 to 2011.

In the Wakhan Corridor of Afghanistan 28 of 30 glaciers examined for the 1976-2003 period retreated at an average rate of 11 m per year (Haritashya and others, 2009).  Zemestan Glacier is an example the glacier has retreated 460 m during this period, about 10% of its total 5 km length. 

North America

Cascade Range

The Cascade Range of western North America extends from southern British Columbia in Canada to northern California. Excepting Alaska, about half of the glacial area in the U.S. is contained in the more than 700 glaciers in the North Cascades, a portion of the range between the Canadian border and I-90 in central Washington. These glaciers store as much water as that contained in the lakes and reservoirs in the rest of the state and provide much of the stream and river flow in the dry summer months, some 870,000 m³. As recently as 1975, many North Cascade glaciers were advancing due to cooler/wet weather during the 1944-1976 period. However, by 1987, all North Cascade glaciers were retreating. However, since 1976 these glaciers have receded rapidly. Between 1984 and 2007, they have lost an average more than 12 m in thickness and 20 to 40% of their volume.[2].  The Easton Glacier pictured below has retreated 290 m since 1985. Columbia Glacier has retreated less 110 m, but has also thinned 20 meters, and retreated at the top of the glacier by 90 m (annual photographic sequence)

Easton Glacier began retreating in 1985 and through 2008 has retreated 290 m, and is currently retreating at a rate of 15 meters/year.


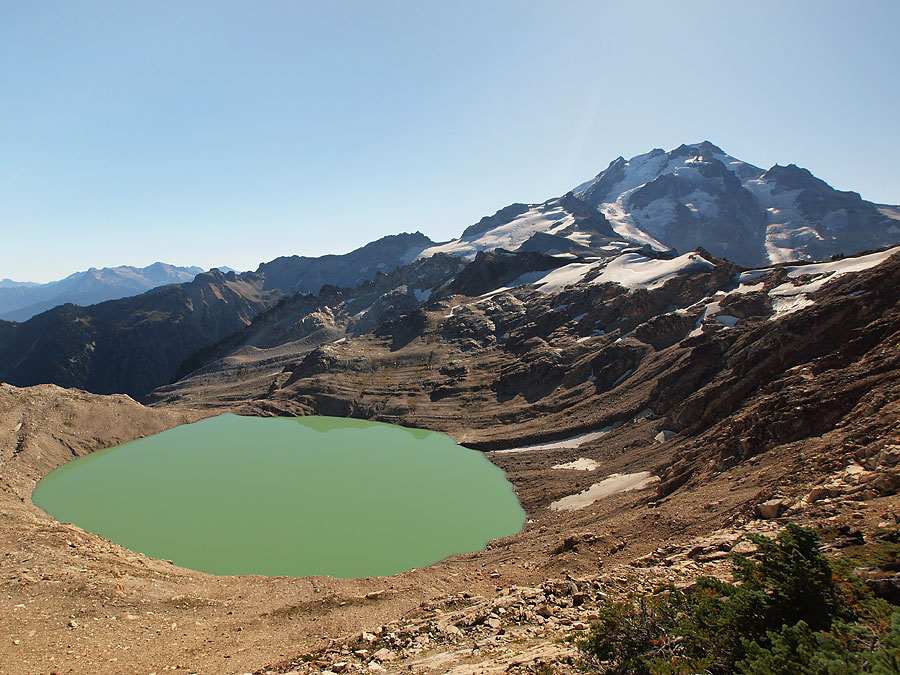
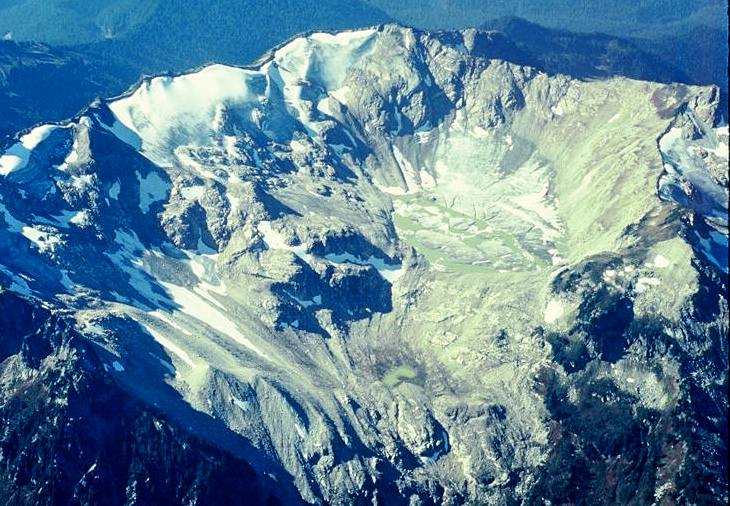
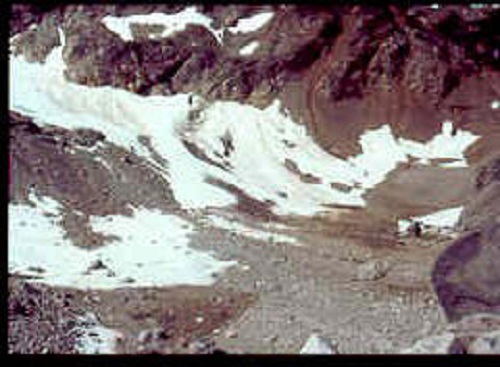
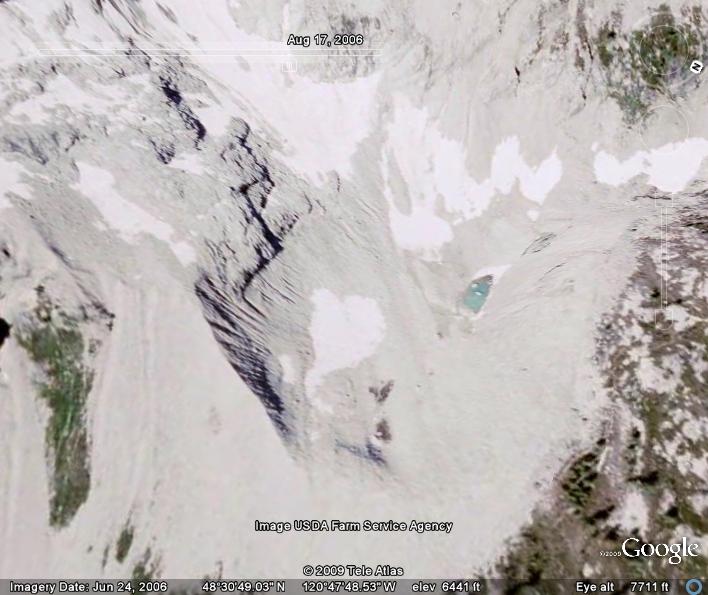
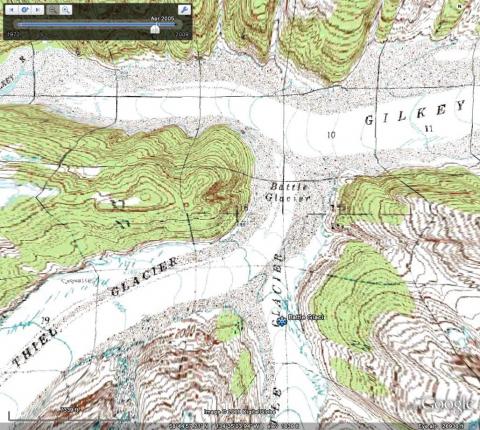
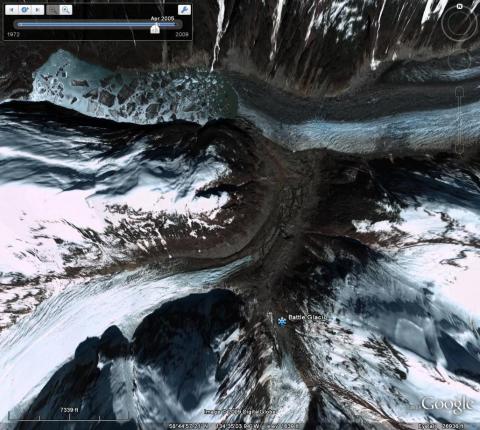
Lyall Glacier, North Cascades with 1966 map outline and SPOT satellite image overlay from 2005.  A new lake has formed and the glacier is gone

This recession is widespread. All 47 monitored glaciers are receding and five have disappeared completely. The White Chuck Glacier (near Glacier Peak) is a particularly dramatic example. It shrank from 3.1 km2 in 1958 to 0.9 km2 in 2002. The Boulder Glacier on the southeast flank of Mount Baker retreated 450 m from 1987 to 2005 leaving unvegetated terrain behind. This retreat has occurred during a period of less winter snowfall and higher summer temperatures. Winter snowpack has declined 25% since 1946 and summer temperatures have risen 1.2 degrees Fahrenheit (0.7 °C) during the same period. Four glaciers have been observed to disappear since 1985; Spider Glacier, Lewis Glacier, Milk Lake Glacier and David Glacier. Currently most North Cascade glaciers are in disequilibrium, meaning they cannot retreat to a point of new equilibrium and can only melt away with the present climate.[3] [4].  Below is the Whitechuck Glacier viewed from the same location in glacier gap in 1973 and in 2005.  This glacier has lost 80% of its area in the last century.  The result is less late summer runoff in the Whitechuck River.  In Mount Rainier National Park and Olympic National Park the story is the same all the glaciers are currently retreating.  Paradise Glacier, Mt. Rainier terminus has risen 1200 feet.  In the Olympics Anderson Glacier has nearly disappeared.  The largest glaciers in each park were advancing 30 years ago Blue Glacier and Cowlitz Glacier but are now retreating rapidly.

Western Canada Mountains

In the Canadian Rockies, the Athabasca Glacier, one of the outlet glaciers of the 325 km² Columbia Icefield, has retreated 1500 m since the late 19th century. This retreat has become more rapid after 1980, following a period of slow retreat from 1950-1980. The Peyto Glacier, covering an area of about 12 km², retreated rapidly during the first half of the 20th century, stabilized by 1966 and resumed shrinking in 1976. Illecillewaet Glacier in British Columbia’s Glacier National Park (Canada) has retreated 2000 m since first photographed in 1887 below.  Bugaboo Glacier  glacier has retreated 420 m since 1972. On the Garbaldi Icefield of the Coast Range of British Columbia all nine glacier examined by have retreated significantly since 1976. Helm Glacier is one of these it has lost  about 25 m of water equivalent, about 28 m of ice thickness lost. That is more than 30% of the glacier lost in just 25 years. The glacier had an area of 4.3 square kilometers in 1928. Today the area has declined by 78% to 0.92 square kilometers.

Illecillewaet Glacier (Great Glacier), circa 1898. Photo Credit: Parks Canada Collection.
Lines mark the extent of ice, Illecillewaet Glacier, Glacier National Park. Photo Credit: Dr. Dan McCarthy, Brock University

On the sheltered slopes of the highest peaks of Glacier National Park, most glaciers are diminishing rapidly. The area of each glacier has been mapped by the National Park Service and the U.S. Geological Survey. Every glacier has retreated notably in the last 140 years. The larger glaciers are now approximately a third of their size when first studied in 1850, and numerous smaller glaciers have disappeared completely. Only 27% of the 99 km² area of Glacier National Park covered by glaciers in 1850 remained by 1993. An increase of approximately 1 degree Celsius (2 °F) in average summer temperatures is reflected in reduced glacier sizes. A computer model indicates that present rates of increasing warming will eliminate all glaciers in Glacier National Park by 2030. This proposed time table for disappearance is too fast.

Glacier National Park’s glaciers have been the focus of long term mapping changes of Sperry Glacier and Grinnell Glacier  and areal extent change mapping of many of the larger glaciers in the Park. Mass balance and ice surface elevation mapping have not been completed; hence satellite imagery must be utilized to assess glacier response.  In the current assessment 10 of the 15 glaciers are experiencing a disequilibrium response and will disappear, the other five have been shrinking little.  Blackfoot and Harrison Glacier are the two largest glaciers and show minimal changes in the accumulation zone. Harrison Glacier has lost only 9% of its area in the last 40 years, and will not disappear soon. Both glaciers continue to retreat with the main termini retreating approximately 100-120 m since 1966.   Three smaller glaciers Ahern, Old Sun and Weasal Collar occupy avalanche fed cirques and continue to maintain significant snowcover even in warm summers such as 2005 and 2007.  The result has been minimal changes in these glaciers. Exposure of significant new bed rock in the accumulation zone was evident on Sperry, Baby, Ipasha, Whitecrow and Shepard Glacier (Figure 10).  Extensive marginal retreat in the accumulation zone is evident on Grinnell, Sperry, Jackson, Kintla, Baby, Whitecrow, Sexton and Shephard Glacier.  Sperry Glacier’s recession is clear in recent satellite imagery. Areal extent losses of these glaciers ranged from 20 to 100% during the 1966-2007 period.   Dixon, Baby and Whitecrow are no longer glaciers with no evident ice mass more than 0.01 km2, Shephard Glacier is nearly gone. Many of the 34 glaciers identified on the 1966 USGS maps, have disappeared, yet a number of glaciers have been experiencing an equilibrium response.  Hall and Fagre (2003) utilized a model to construct the future of glaciers in the Blackfoot-Jackson watershed, and determined that all would be gone by 2030 with continued substantial warming, but not with limited additional warming.  Based on the slow recession and equilibrium response of Blackfoot and Harrison Glacier to recent climate over the last 40 years these two glaciers are not going to disappear within the next 30 years.  There are at least five glaciers in the park that have retreated slowly in the last 40 years and still have healthy accumulation zones, indicating they are not on the verge of disappearing.  As Hoffman and Fountain (2007) noted  has noted as glaciers shrink to a small size they can be tough to eliminate if they have an accumulation area.

Harrison Glacier, Glacier National Park, the glacier margin in 2005 and orange line showing the 1966 margin map overlay on this SPOT satellite image. No evident change in the accumulation zone indicates an equilibrium response.
Shephard Glacier, Glacier National Park, the glacier margin in 2005 and orange line showing the 1966 margin map overlay on this SPOT satellite image. Much of the accumulation zone of the glacier is now gone indicating a disequilibrium response.

The semiarid climate of Wyoming still manages to support about a dozen small glaciers within Grand Teton National Park which all show evidence of recession over the past 50 years. One of the more easily reached of the glaciers in the Park known as “Schoolroom Glacier” is expected to be gone in 25 years. Research between 1950 and 1999 demonstrated that the glaciers in Bridger-Teton National Forest and Shoshone National Forest in the Wind River Range shrank by over a third of their size over that period. Photographs indicate that the glaciers today are only half the size as when first photographed in the late 1890’s. Research also indicates that the glacial retreat was proportionately greater in the 1990s than in any other decade of the last 100 years. [5]  Glaciers in the region have experienced ongoing negative balances and glacier shrinkage.  Examination of Dinwoody and Gannett Glacier indicated relatively little change in terminus position or areal extent from 1958-1983 [6].  Since 1983 retreat rates have again accelerated on these two glaciers.  There is are no recent field observations of mass balance, glacier thickness or glacier extent change in the Wind River Range, and satellite imagery is the only means to assess glacier response in the region to climate change over the last 40 years.  Of the 15 glacier examined six have experienced insignificant change in glacier margin and ice thickness.  Gannett and Dinwoody Glacier are the two largest glaciers in the range and despite significant terminus retreat, the accumulation zones remain unchanged.  On Fremont Glacier  the change in areal extent is 11%.  Of the nine glaciers in disequilibrium J, Twins, Grasshopper, Minor, Heap Steep, Mammoth and Lower Fremont Glacier exhibit significant new bedrock exposure within the accumulation zone.  Marginal retreat in the accumulation zone is evident on Baby, J, Twins, GrasshopperMinor , Heap Steep, Helen and Lower Fremont Glacier.   Knife Point Glacier has lost 31 % of its area since 1966, but all the change is in the terminus area of the glacier, 280 m of retreat, and one small tributary chute on its northern margin.  Grasshopper Glacier has experienced 640 m of retreat and 27% reduction in areal extent, with most of the reduction in the accumulation zone.  These examples indicate the difficulty in using only terminus change or areal extent change in determining equilibrium response. 

Fremont Glacier, Wind River Range, the glacier margin in 2005 and orange line showing the region where the margin is not the same from the 1966 map overlay on this SPOT satellite image. No evident change in the accumulation zone indicates an equilibrium response.
Minor Glacier, Wind River Range, the glacier margin in 2005 and orange line showing the glacier margin from the 1966 map overlay on this SPOT satellite image. Much of the accumulation zone of the glacier is now gone indicating a disequilibrium response.

Alaska

Valdez Glacier has thinned 300 feet over the last century and the unvegetated brown areas near the glacial margins have been exposed due to the glacier thinning and retreating over the last 2 decades of the 20th century

Alaska is home to thousands of glaciers, most still unnamed. One of the more famous glaciers is Columbia Glacierr, near Valdez. It was a course change to avoid icebergs from this glacier that ultimately resulted in the 1989 Exxon Valdez oil spill. Columbia Glacier, which terminates in a grounded calving margin in Prince William Sound in central coastal Alaska, has retreated 15 km in the last 25 years. The Valdez Glacier pictured is in the same area, does not calve but has retreated throughout the century. Calving glaciers can retreat faster via calving icebergs, than glaciers that do end in a calving front.  Bear Glacier and Yakutat Glacier are examples of rapidly retreating glaciers that are calving into proglacial lakes.  Bear Glacier has retreated more than 3 km this decade.  Yakutat Glacier has receded 4 km in the last 50 years.

A 2005 aerial survey of Alaskan coastal glaciers identified more than a dozen glaciers, many former tidewater and calving glaciers, including Grand Plateau, Alsek, Bear, and Excelsior Glaciers that are rapidly retreating. Of 2000 glaciers observed, 99% are retreating.

The Juneau Icefield Research Program has monitored the outlet glaciers of the Juneau Icefield since 1946. On the west side of the icefield from 1946-2005 the terminus of the Mendenhall Glacier, which flows into suburban Juneau has retreated 580 m, Herbert Glacier five miles north has retreated 910 m, Eagle Glacier another five miles north has retreated 1090 m, Gilkey Glacier has retreated 3.9 km since 1950. On the south side of the icefield Norris Glacier retreated 1740 m the East Twin Glacier 720 m and the West win Glacier 570 m. Only the Taku Glacier has advanced. This glacier was advancing in 1890 when viewed by John Muir and had a large calving front. By 1963 the glacier had advanced 3.7 miles. In 1948 the fjord had filled in and the glacier no longer calved. It was just like finishing payment on a home mortgage, the glacier no longer lost icebergs and was able to continue its advance of a further 0.5 miles. In 2005 the glacier is only 0.93 miles from reaching Taku Point and blocking Taku Inlet, and is advancing at a rate of 17 m/year. The mass balance was very positive for the 1946-1988 period fueling the advance, however, since 1988 the mass balance has been slightly negative which should in the future slow the advance of this mighty glacier. Glacier retreat is driven by negative mass balance. Long term mass balance records from Lemon Creek Glacier show declining mass balance with time [7]. The mean annual balance for this glacier was –0.23 m/yr 1957-1976. Mean annual balance has been increasingly negative since 1977, averaging -0.78 m/yr. The record is particularly negative since 1990, -1.04 m/yr, indicating even more rapid glacier retreat. Repeat glacier altimetry for 67 Alaska glaciers find rates of thinning have increased by more than a factor of two when comparing the periods from 1950 to 1995 (-0.7 m/yr) and 1995 to 2001 (-1.8 m/yr). [8] This is a systemic trend with loss in mass equaling loss in thickness, which leads to increasing retreat.

Gilkey Glacier in the 1950 USGS topographic map, no terminal lake and is still connected to Thiel Glacier
Gilkey Glacier in 2005 note the new lake that had formed and the lack of connection between Thiel Glacier and Gilkey Glacier.

Beginning in the 1990’s, using a laser measuring device mounted on the underside of an airplane, researchers compared glacier altitude differences with ground survey maps created in the 1950’s. 85% of the glaciers flown over stretching from Alaska to Washington state had a reduction in altitude, and therefore, a thinning of the glacial mass. Further flights since then indicate that this thinning is accelerating and is now double what it was in the 40 years before the mid 1990’s. [9] The glaciers of Denali National Park are shrinking. The National Park Service has been chronicling the retreat with repeat photographs of glaciers from locations where historic photographs exist. The program has been a cooperation between glaciologist Guy Adema and photographer Ron Karpillo.  In Denali National Park the terminus of the Toklat Glacier is retreating 24 m/year and the Cantwell Glacier 10 m/year. East Taklanika Glacier has also retreated  1100 m between . In that time the lower section of the glacier has lost over 100 m of ice thickness.  There are many surging glacier in the Park and in Alaska whose terminus responses are part due to climate and part due to surging behavior.

Europe: Alps

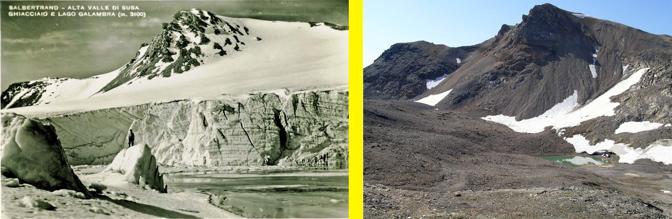
The World Glacier Monitoring Service reports on changes in the terminus position of glaciers from around the world every 5 years. The 1995-2000 Edition notes the frontal variations of glaciers across the Alps and in Switzerland. In 2005 for the first time ever all glaciers examined in Switzerland were retreating.  In 2009 Switzerland reported 81 glacier retreated, 5 were stationary and 2 advanced.  Of 93 glaciers surveyed by the Austrian Alpine Club in 2009, 85 receded, 7 were stationary and 1 advanced.  Similarly, in Austria 95 of 99 glaciers were retreating, in Italy all 69 observed glaciers were in retreat and in France all 6 were retreating. French glaciers experienced a sharp retreat in the years 1942-53 followed by advances up to 1980, then further retreat from 1982. As an example the Argentière Glacier and Blanc Glacier have receded by 1150 and 1400 meters respectively since 1870. The largest glacier Chamonix remembers the Bossons Glacier coming almost as far as the road. It has lost 1200 meters in length. This shrinking is not without risks. Glacial lakes have formed at the foot of the Mer de Glace. The lakes are held behind moraine dams. If the natural dams that hold this meltwater back break, it could cause widespread flooding in the valley below. In 1892 the lake of the Glacier de Tête Rousse burst emptying some 200,000 m33 of water and killing 200 people in Saint Gervais. Ski areas in Austria have covered areas of the Stubai and Pitztal Glacier with plastic wrap to retard melting of the glaciers that their ski areas utilize. Since 1980, 20% of the area of Swiss glaciers has been lost. The Grosser Aletsch Glacier is the largest glacier in Switzerland and has retreated 2600 m since 1880. Triftgletscher has retreated 100 meters in the last decade. The rate of retreat has increased after 1980, with 800 m or 30% of the total retreat occuring in the last 25 years.  Cavagnoli Glacier  typically loses all of its snowcover by summer’s end and has separated into five segments, none sufficient to survive current climate.  In the Italian Alps the percentage of retreating glaciers has increased from 34% in 1980 to 96% in 1999, and has remained above 95% through 2005.  By 2008 half of the volume of Italian glacier had been lost.  The Galambra Glacier had largely disappeared as seen in the the photo pair from the Italian Glacier Commission in 1954 at left. and 2009 at right.  Below are graphs of the percentage of retreating Swiss Glacier and Italian Glaciers from the respective nations Glacier Commissions.

Pyrenees:  In the Pyreenees 15 of 16 glaciers observed retreated from 2000 to 2005.  Maladeta Glacier has lost 70% of its area since 1850 and 25% 

Scandinavia

In the Kebnekaise Mountains of Northern Sweden of sixteen glaciers examined from 1990-2001, 14 are retreating, one is advancing and one is stable. During the 20th century glaciers in Norway retreated as did glaciers in other parts of the world at the end of the Little Ice Age. Most Norwegian glaciers did have brief periods of advance around 1910, 1925 and in the 1990’s. In the 1990s 11 of 25 Norwegian glaciers observed advanced due to several winters in a row with precipitation above normal. Since 2000, Norwegian glaciers have decreased significantly. This resulted from several consecutive years of little winter precipitation, and record-warm summers in 2002 and 2003. By 2005 Only 1 of the 25 glaciers was advancing, two were stationary and 22 were retreating. Engabreen has retreated 179 meters since 1999, while Brenndalsbreen and Rembesdalsskåka have retreated 116 and 206 meters since 2000. At Briksdalsbreen the glacier retreated 96 m in 2004, this is the largest annual retreat recorded since monitoring started in 1900. Since 1999, the glacier has retreated 176 meters. In 2009 the number of retreating glaciers was 18 with 3 stationary and 2 advancing.  In 2010  31 glaciers in Norway were assessed 27 glaciers retreated, one glacier was stable, and three glaciers advanced.  The average ternminus change for the decade was -190 meters.

Iceland

The Breidamerkurjökull, one of the glaciers that is an outlet of the Vatnajökull, the largest ice cap in Europe, has receded by as much as 2 km since 1973. A hundred years ago Breidamerkurjokull, extended to within 250 m of the ocean, Today, Breidamerkurjokull’s terminus is three kilometers from the ocean. The glacier retreat has exposed a rapidly expanding lagoon, which is filled with icebergs calved from its front. The lagoon is 350 feet deep and has nearly doubled its size during the past decade. All but one of the Vatnajokull outlet glaciers, roughly 40 named glaciers in all, are receding as of 2000 Tungnaarjokul is retreating at 50  meters per year. Gigjokull had retreated 700 meters in the 15 years before the Eyjafjallajökull eruption in 2010. 

Svalbard

Glaciers in Svalbard have been retreating at an increasing rate in the last 20 years.  The Polish Research Station in Hornsund built in 1957 has provided a base for observation of the glacier retreat.  Hansbreen, Hornbreen and Hambergbreen are three of these glaciers that have retreated.  Pälli et al (2003) in a joint University of Oulu, Finland and University of Silesia noted that Hornbreen (HO) has retreated by 13.5 km, Hambergbreen (HA) by 16km and Hornbreen 2.5 km from 1901-2000.  Below is a map from Silesia University Research (1984), showing 1983 ice fronts and on the right a Landsat image showing the retreat and separation of the Hornbreen into four separate glaciers.

Greenland

Despite their proximity and importance to human populations, the mountain and valley glaciers of temperate latitudes amount to a small fraction of glacial ice on the earth. About 99% is in the great ice sheets of polar and subpolar Antarctica and Greenland. These continuous continental-scale ice sheets, 3 kilometers or more in thickness, cap the polar and subpolar land masses. Like rivers flowing from an enormous lake, numerous outlet glaciers transport ice from the margins of the ice sheet to the ocean.  The dominant means of discharge from the ice sheets is via calving icebergs not ice and snow melt.

Glacier recession has been observed in these outlet glaciers. This can increase the ice flow rate and destabilize the mass balance of the ice sheet that is their source. In Greenland the last five years has brought retreat to several very large glaciers that had long been stable. Three glaciers that have been researched, Helheim, Jakobshavns and Kangerdlugssuaq Glaciers, jointly drain more than 16% of the Greenland Ice Sheet. In the case of Helheim Glacier, researchers used satellite images to determine the movement and retreat of the glacier. Satellite images and aerial photographs from the 1950s and 1970s show that the front of the glacier has remained in the same place for decades. But in 2001 it began retreating rapidly, retreating four and a half miles (7.2 km) between 2001 and 2005. Jakobshavns has also accelerated from 20 m/day to 32 m/day. [10].  Of the 39 major outlet glaciers, 35 have retreated notably in the last decade, losing a combined 1590 square kilometers (Box and Decker, 2011).  The Greenland Ice Sheet index is a compendium of specific examples of recent glacier behavior.

Jakobshavns Isbrae in west Greenland, a major outlet glacier of the Greenland Ice Sheet, is generally considered the fastest moving glacier in the world. It had been moving continuously at speeds of over 24 m/day with a stable terminus since at least 1950. In 2002, the 12 km long floating terminus entered a phase of rapid retreat. The ice front started to break up and the floating terminus disintegrated. The glacier accelerated to over 30 m/day.[11]

The rapid thinning, acceleration and retreat of these three large oulet glaciers in close association with one another suggests a common triggering mechanism.   Since the acceleration is not seasonal and because it began at the ice front and propagated inland it cannot be due to the commonly cited meltwater lubrication of the ice sheet base.  Instead the acceleration is most pronounced in marine terminating outlet glaciers.  These glaciers have calving fronts.  The acceleration is year around.  Thinning at the terminus increases buoyancy reducing friction and back forces.  This allows acceleration [12]. 

Petermann Glacier, seen below, in northwest Greenland calved off a large section of ice, 29 square km, at its terminus in 2008.  In August 2010 an even larger section of  over 200 km 2 calved from thisglacier.  The glacier has the longest floating tongue of any glacier in the Northern Hemisphere, nearly 80 km long. This unlike the Jakobshavns is slow, moving and thin making it vulnerable to rapid breakup.

Miitivakkat Glacier, which is not a calving glacier is also retreating and losing mass at increasing rates (Mernild et al 2011).  The image of mass balance and terminus change are below those of Petermann Glacier and are from Mernild et al 2011.

The nearby Humboldt Glacier has the longest terminus face in contact with the ocean of any Greenland outlet glacier.  This glacier has a had steady retreat in the last 20 years.  The glacier is aground and cannot calve off large pieces or accelerate dramatically.  It is clear that regardless of the type of glacier and their specific sensitivities all are retreating due to global warming (Bailey and Pelto, 2011).

The ongoing retreat is leading to the formation of new islands along the Greenland Coast, Upernavik Glacier and Kong Oscar Glacier.

Africa

With almost the entire continent of Africa located in the temperate zone, the few places that glaciers do exist are restricted to two isolated peaks and the Ruwenzori Range. What has been popularized as the “snows of Kilimanjaro” on Mount Kilimanjaro, which at 19,340 feet (5,895 m) is the highest peak on the continent, may be a thing of the past in less than 30 years. Since 1912, the glacier cover on the summit of Kilimanjaro has apparently retreated 75 % and just from the period of 1984 to 1998, one section of glacier receded 300 meters vertically. A report from March 2005 indicated that there is almost no remaining glacial ice on the mountain and it is the first time much of the surface of the summit has been observable in 11,000 years. Observers believe that there will be no more glacial ice on the summit of Kilimanjaro by the years 2015 to 2025. Mount Kenya which at 17,057 feet (5,199 m) is the second tallest mountain on the continent and has up to a dozen small glaciers has shown a loss of area at least 45 % since the middle part of the 20th century.

The Ruwenzori Range which rise to 16,761 ft (5,109 m), are to the west of the isolated peaks of Kilimanjaro and Kenya. These mountains are oftentimes cloud capped, making satellite imagery difficult and the political dynamics of the surrounding region have made access complicated at best over the past few decades. However, photographic evidence demostrates a marked reduction in glacially covered regions over the past century. It is expected that due to their closer distance to the heavy moisture of the Congo region, the glaciers in the Ruwenzori Range may recede at a slower rate than either Kilimanjaro or Kenya.

Caucasus

Stokes et al (2007) used satellite imagery to observe 113 glaciers in the region from 1980-2000 and found 95% to have retreated. They observed that the rate of retreat had increased and that a number of new lakes had formed due to the retreat. Djankuat and Garabashi Glacier have had mass balance measurements and all have had substantial negative balances since 1985.  The word for glacier is Lednik in this region.  Lednik Fytnargin is an example of the recent rapid retreat with 450 m from 2006-2009.

Oceania

The vast moraine wall is evidence of the retreat of the Mueller glacier, which is covered in rubble. In the distance a further lake and moraine wall show where the glacier has retreated

In New Zealand the mountain glaciers have been in a general recession since 1890, with an acceleration of this recession after 1920. Most of the glaciers have been reduced in size and the accumulation zone had a corresponding rise to higher elevations as the 20th century progressed. During the period of 1971 to 1975, Ivory Glacier was reduced 30 m at the glacial terminus and the loss of ice during the period was 13.9 x 10⁶ m3 the retreat has been ongoing, the NIWA has noted a retreat of 180 m per year on average since the 1990’s. The proglacial lake at the terminus continues to expand as the glacier retreats upvalley. The lake is deep and the valley has little gradient, thus the retreat will continue. Imagery of Tasman Glacier indicates the future it faces. There was no lake in 1973 and now it is more than 7 km long.

Tasman Glacier with the new terminus lake and the stagnant debris covered terminus region.
Volume of New Zealand southern Alps Glaciers as reported by the NIWA.

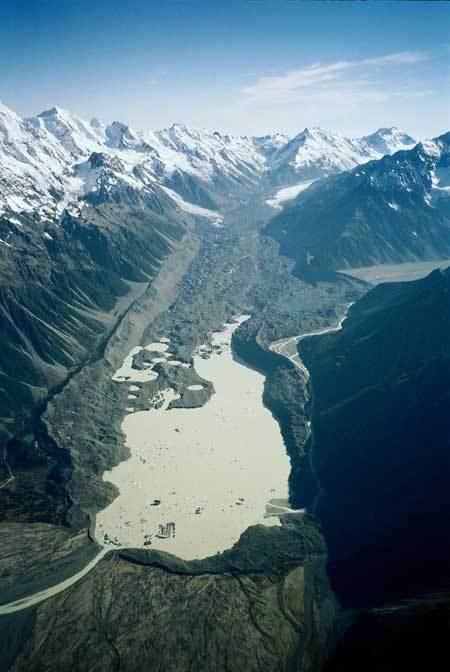
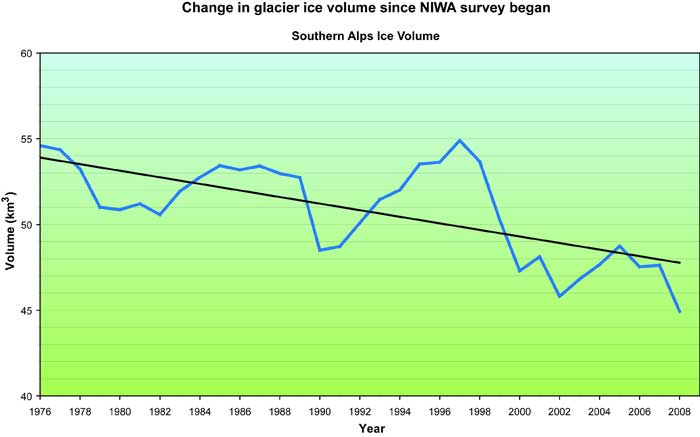
Several glaciers, notably the much visited Fox and Franz Josef Glaciers, have periodically advanced (especially during the 1990s) but the scale of these advances is small compared to 20th century retreat. These rapid flowing large glaciers with steep trunks have been very reactive to small mass-balance changes. A few years of favorable conditions are rapidly echoed in a corresponding advance, followed equally rapidly by renewed retreat when those favorable conditions end. [13]

USGS Puncak Jaya glaciers 1936 and 1972. Top to bottom: Northwall Firn, Meren Glacier, and Carstensz Glacier. USGS

On the large island of New Guinea, there is photographic evidence of massive glacier recession since the region was first extensively photographed in the early 1930s. Due to the location of the island within the tropical zone, there is little to no seasonal variation in temperature. The tropical location has a predictably steady level of rain and snowfall, as well as cloud cover year round and there has been no noticeable change in the level of moisture which has fallen during the 20th century. Therefore, the glacial retreat evidenced can only be attributed to a general warming trend. The 7 km glacial cap on the mountain known as Puncak Jaya is the largest on the island, and has retreated from one larger mass into several smaller glacial bodies since 1936. Of these glaciers, between 1973 and 1976, the Meren Glacier retreated 200 m and the Carstensz Glacier retreated 50 m over the three year period. The third larger area that was once part of the icecap known as the Northwall Firn, had split into several smaller glaciers by 1972. One small icecap known to exist on the summit of Puncak Trikora completely disappeared sometime between 1939 and 1962. [14] All the glaciers on the island are located within the country of Indonesia and separatist rebels in the area led the Indonesian Government to close off most access to the region in 1995. However, research presented in 2004 of imagery from the IKONOS satellite of the New Guinean glaciers provided a dramatic update. The imagery indicated that between the years 2000 and 2002, the East Northwall Firn had lost 4.5%, the West Northwall Firn 19.4% and the Carstensz 6.8% of their glacial mass in only those two years. The presentation went on to state that “Sometime between 1994 and 2000 the Meren Glacier appears to have disappeared.”. The end result is a decline in glacier area from 18.8 to 2.1 square kilometers.

Andes Mountains

More than 80 % of all glacial ice in the northern Andes is concentrated on the highest peaks in smaller glaciers of one km² in size. Chacaltaya Glacier in Bolivia and Antizana Glacier in Ecuador were examined between 1992 and 1998 showed that between 0.6 and 1.4 m of water was lost per year on each glacier. Chacaltaya Glacier lost two-thirds of its volume and 40 % of its thickness over the same period and it is expected that by 2010 to 2015, Chacaltaya Glacier will no longer exist. Chacaltaya Glacier is only 10 % of its size when first examined in 1940. The evidence also supported findings that since the mid 1980’s, the rate of recession for both glaciers has also been increasing. [15].  In 2009 the Chacaltaya Glacier has disappeared.  The nearby Zongo Glacier has been retreating at a rate of 18 m per year.

Zongo Glacier in 2000
Zongo Glacier in 2005.

Further south in Peru, the Andes are much taller overall and there are 722 glaciers covering an area of 723.4 km². Research in this region of the Andes is less conclusive but indicate that between 1977 and 1983, a glacial recession of 7 % occurred. [16][17] More recently work on Quelccaya Ice Cap indicates considerable change, with 15% loss in the size of this ice cap since 1963 (Thompson et al 2011).

A large region of population surrounding the central Andes of Argentina and Chile reside in arid areas that are dependant on water supplies from melting glaciers. The water from the glaciers also supply rivers that have in some cases been dammed for hydroelectric power. Some researchers think that by 2030, many of the large ice caps on the highest Andes will be gone, if current trends continue. In Patagonia on the southern tip of the continent, the large ice caps have been shown to have retreated a full kilometer since the early 1990s and 10 km since the late 1800s. Nearly 90% of the glaciers studied are affected. Of the 72 glaciers surveyed in the region 63 have retreated significantly, only eight have remained stable and one advanced. O’Higgins Glacier, which feeds the Pascua River has retreated 11.6 km.  Nef Glacier is an example of this retreat having retreated 2.5 km in the last 15 years.  It has also been claimed that Patagonia glaciers are receding at a faster rate than any other region in the world. [18] 

Antarctica

The collapsing Larsen B Ice Shelf is similar in area to the U.S. state of Rhode Island.

The most dramatic glacier recession is the loss of large sections of the Larsen Ice Shelf on the Antarctic Peninsula. The collapse has been due to warmer melt season temperatures leading to surface melting and the formation of shallow ponds of water on the ice shelf. The Larsen Ice Shelf lost 2,500 square kilometers from 1995 to 2001. Then, a total of about 3,250 km2 of shelf area disintegrated in a 35-day period beginning on 31 January 2002. The ice sheet is now 40 percent the size of its previous minimum stable extent. The Wilkins Ice Shelf has experienced substantial ice losses in 2008 and 2009. [19]

Wordie Ice Shelf was the northernmost large Ice shelf on the western AP. The ice shelf disintegrated between 1970 and 2000. From an area of 1900 km2 in 1970 to 100 km2 in 2009 as mapped by the British Antarctic Survey. The first image is a map illustrating its demise put together by the BAS and USGS, adjacent to that is the rifted and breaking up front of Fleming Glacier.  An examination of 244 marine glacier fronts on the Antarctic Peninsula and associated islands over the past 61 years indicates that 87% have retreated.  A clear boundary between mean advance and retreat has migrated progressively southward.[20].  Fleming Glacier has accelerated as the Wordie Ice Shelf disintegrated.

Pine Island Glacier, which flows into the Amundsen Sea thinned 3.5 ± 0.9 meters per year and retreated five kilometers in 3.8 years. This glacier has thinned, accelerated and undergone retreat, in much the same pattern as the calving outlet glaciers of Greenland.  The difference is that there is no surface melting, the thinning must come from basal melt.  Further the glacier bed remains at least 500 meters below sea level for 200 kilometers inland of the current grounding line, and is deeper during this entire length than the current grounding line is. The end of the glacier is a floating ice shelf that would remain floating as it retreated over this entire distance. The location where the glacier becomes afloat is retreating 1.2 km/year. This glacier drains a substantial portion of the West Antarctic Ice Sheet and has been called the weak underbelly of this ice sheet.[19]. Dakshin Gangotri Glacier is a small outlet glacier of the continental ice sheet. It receded at a rate of 7 m/decade from 1983 to 2002.

The pattern of glacier retreat has led to a new question, it is not how fast are they retreating, but which are going to survive and for how long.