Recent Climate Change in the North Cascade Glacier
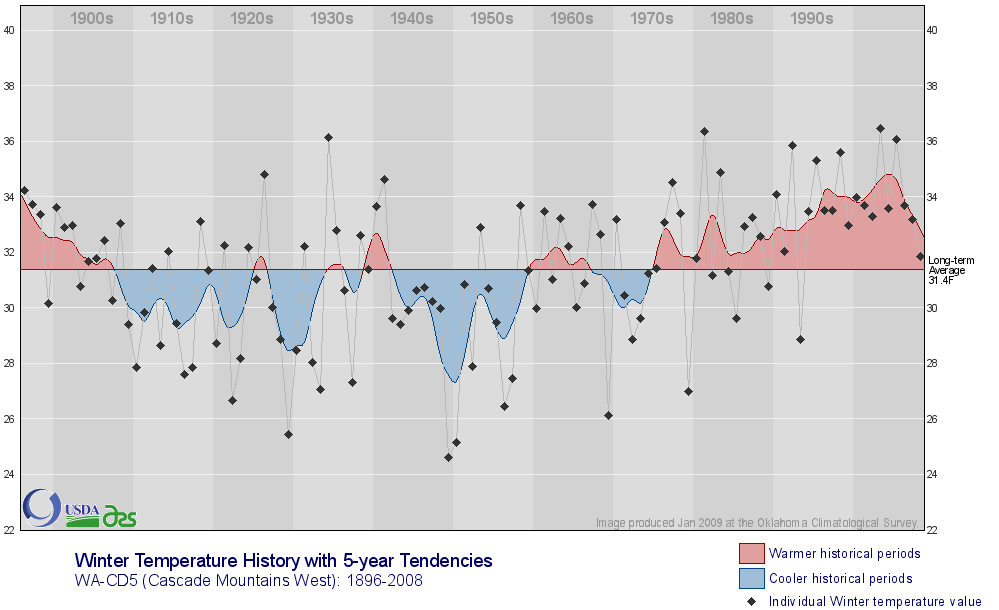
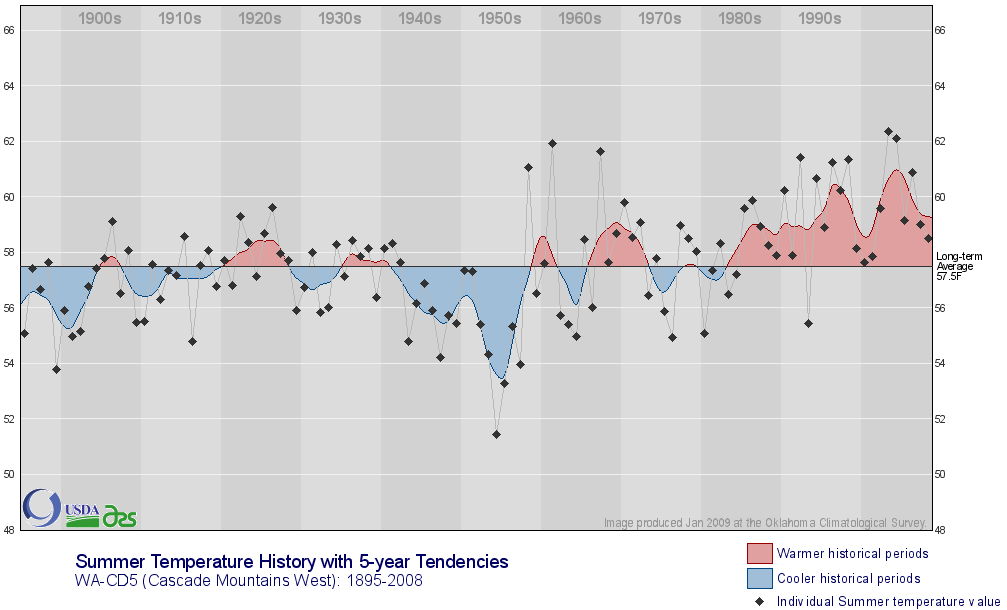
Glaciers are primarily sensitive to winter snowfall and summer temperature. Winter snowpack on April 1 has declined markedly over the long terms whether you begin the comparison in 1934, 1944, 1950 or 1966. The change ranges from a decline of 23 to 48% at the five North Cascade snow measurement sites of the USDA that have existed for the entire period. (Fish Lake, Lyman Lake, Miners Ridge, Rainy Pass and Stevens Pass) Since 1980 snowpack has not declined. The long term declines occurred despite an increase in winter precipitation.


The best measure of overall climate for glaciers is the Pacific Northwest Index developed by Curtis Ebbesmeyer (PNI DATA) at the University of Washington. This index is based on the annual temperature at Olga, WA, Annual precipitation at Cedar Lake WA and March 15 snowpack depth at Mt. Rainier WA. The chart below indicates the variation of the PNI with time. It has been consistently high since 1977. The PDO (Pacific Decadal Oscillation was identified to be the main atmospheric circulation controller of Pacific Northwest Climate by Mantua and Hare at University of Washington. Note the trendline through time of PDO and PNI in the five year moving average are relatively close.
Rising and high values of PNI result in glacier retreat. Low values in glacier expansion.
Mean PNI for the 1920-1944 period was 0.42 triggering glacier retreat.
Mean PNI from 1945-1975 was -0.32 triggering glacier some glaciers to advance.
Mean PNI from 1976-2004 was 0.48 triggering glacier retreat.

Is the PDO which is the only interdecadal circulation index the key? You can see at left the relationship between PDO and SWE the scatterplot shows it is poor. This is true for glacier mass balance as well.

The PDO and SWE trends illustrate the strong correlation from 1952-1960 and 1965-1982. Since 1982 PDO has been out of sync with SWE. Note that the PDO axis is inverted as moist years are more associated with high SWE. This suggests to me that PDO is important, and sometimes is the primary control, but currently other factors are key. Is one of these ENSO?

There is a correlation between ENSO and SWE it does not always it is not a strong correlation indicating other factors are important just like with the PDO. What is most evident is that PDO and ENSO variations do not explain most of the changes in recent annual glacier mass balance to very negative values..

In this graph below annual glacier mass balance is on the secondary y-axis and the axis values are inverted. It is apparent that ENSO more of an annual circulation index and PDO a decadal index are not since 1997 reliably correlating with glacier annual balance. This is similar to the lack of coherence with SWE.

The map below is from the Oregon Climate Service showing the changes in Annual precipitation. Note the peak values for precipitation occur in the Monte Cristo-Sloan Peak area just southwest of Glacier Peak.
