Abstract
 Annual net balance on eight North Cascades glaciers during the 1984-1994 period has been determined by measurement, of total mass loss from firn and ice melt and, of residual snow depth at the end of the summer season. Overall spatial density of measurement points is 200 points km-2. Mean annual balance of North Cascade glaciers from 1984-1994 has been -0.38 m a-1. The resulting 4.2 m loss in water equivalant thickness is significant, since North Cascade glaciers have an average thickness of 30-50 m.
Cross correlation of annual net balance for eight glaciers range from 0.83 to 0.97. This indicates the mass balances of the eight glaciers have been responding similarly to climate conditions despite their range of topographic and geographic characteristics. Annual net balance of individual glaciers was correlated with climate records. The highest ablation season correlation coefficient is mean May-August temperature, ranging from 0.63-0.84. The highest accumulation season correlation coefficient is total accumulation season precipitation, ranging from 0.35-0.59.
Mass Balance Measurement
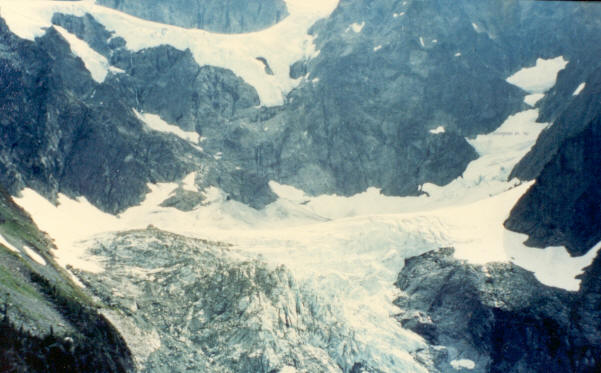
The North Cascades mountains are host to approximately 725 glaciers (Figure 1)(Post et al., 1971; Pelto, 1993). The North Cascade Glacier Climate Project (NCGCP) was founded to identify the response of North Cascade glaciers to regional climate change. Ebbesmeyer (et al., 1991) noted the broad impact of a regional climate change occurring in 1976, identifying a significant shift in 40 environmental factors that are sensitive to climate. Glacier response to alpine weather patterns and climate is complicated by local effects. Thus, to understand the causes of, and nature of changes in, glacier mass balance it was necessary to monitor a significant number of glaciers. Since 1984 the North Cascade Glacier Climate Project (NCGCP) has monitored annual net balance on at least 8 North Cascade glaciers (Pelto 1988; 1993). To monitor this number of glaciers in the United States is not feasible financially or logistically using standard mass balance methods. A modified stratigraphic method based on an observable summer surface is used to reduce logistical costs.
Annual balance is the difference between annual snow accumulation and snow-firn-ice melt (ablation). Mass balance measurements are made on the same date each year in August and again in late September close to the end of the ablation season. The late September date is considered the end of the hydrologic year for that glacier. Any mass balance changes occurring before the actual accumulation season begins is a measured mass loss or gain for the next hydrologic year. Annual ice and firn ablation (firn and ice net balance: Mayo et al., 1972) is determined using ablation stakes drilled into the glacier surface and simultaneously checked on the same date in late September. Residual snow accumulation (final late snow balance: Mayo et al., 1972) at the end of the ablation season is determined using probing and crevasse stratigraphy on the same date as ablation measurements are completed. The methods used are patterned after mass balance studies on Lemon Creek Glacier, Alaska and Blue Glacier, Washington (Heusser and Marcus, 1964; LaChapelle, 1965; Armstrong, 1989). The only difference between the methods used on Blue Glacier (LaChapelle, 1965; Armstrong, 1989) and in this study are: 1) snow density is not measured, 2) a order of magnituder higher measurement density is used.
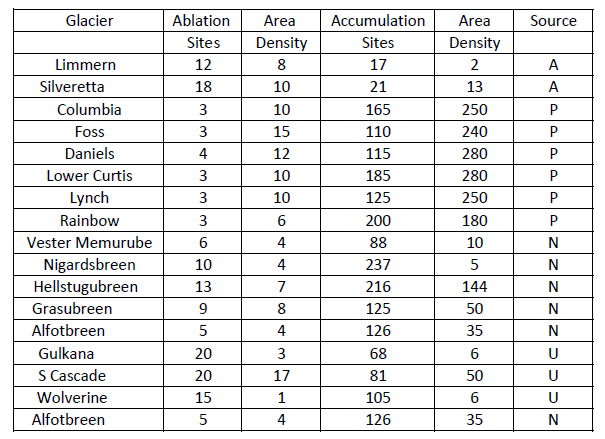
Only accumulation measurements are made above the snow line in the accumulation zone. In the accumulation zone, annual accumulation layer thickness is determined using crevasse stratigraphy, and probing. Measurements are made in August and again in late September. The August measurements are made to determine snowmelt runoff for the late summer period and are not used in the final annual balance assement. The average density of measurements utilized in this study is 290 points km-2, while the average density of measurements used in assessing the mass balance in the accumulation zone of other Canadian, Norwegian, Swiss and United States glaciers is 33 points/km-2 (Meier, et al., 1971; Pytte, 1969) (Table 1). This higher density is achieved by focussing on time efficient measurement methods.
The accumulation layer thickness is measured at each point to the nearest 0.01 m. Crevasse stratigraphy measurements are conducted only in vertically walled crevasses with distinguishable dirt bands. Crevasses lacking vertical walls yield inaccurate depth measurements. In the North Cascades the ablation surface of the previous year is always marked by a 2-5 cm thick band of dirty firn or glacier ice. The depth to the top of this dirty band is measured at several points on each crevasse wall within a distance of several meters. The average thickness of the several points is taken to be the accumulation layer thickness at that location.
We completed more than 100 snowpits from 1984-1986, the range in mean accumulation layer density observed was 0.58-0.63 g/cm3. This narrow range indicates that late in the ablation season the density of snowpack on North Cascade glaciers is uniform, and need not be measured to determine mass balance. For this reason snowpits are no longer utilized. The lack of density variation has been observed in the two other mass balance programs in Washington on Blue Glacier and South Cascade Glacier (Armstrong, 1989, Meier and Tangborn, 1965). Of equal importance is that the range of density variation is of the same order as the density measurement error, determined through repeat measurements. Since North Cascade glaciers rarely have ice lenses, an indicator of little internal accumulation, probing is an accurate method of measuring accumulation layer thickness. The lack of ice lenses is also crucial to having a constant snow density. The probe is driven through the snowpack until the previous ablation surface is reached, this surface of glacier ice or dirty hard firn cannot be penetrated. The probing instrument is a 1/2 inch thick type L copper tube which is driven through the snowpack using a 1 kg weight.
 The accuracy of crevasse stratigraphy and probing measurements are cross-checked by comparing for consistency. On each glacier, at least 25% of the accumulation area is a zone of overlap where both probing and crevasse stratigraphy are used. This cross checking identifies measurement points that either represent an ice lens and not the previous summer surface in the case of probing, or areas where crevasses do not yield representative accumulation depth in the case of crevasse stratigraphy.
The standard deviation in snow depth obtained in cross checking and duplicate measurments are smallest for crevasse stratigraphy, 0.02 m, and 0.03 m for probing. The narrow range of deviation in vertically walled crevasses indicates that they do yield consistent and representative accumulation depths late in the summer. After a decade of predominantly negative mass balance, the number of crevasses that are sufficiently open to complete measurements has declined significantly.
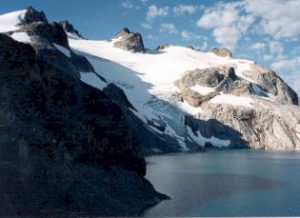
To ensure that mass balance measurements are consistent from year to year, measurements are made at a spatially fixed network of points using the same methods on the same date each year. The network is fixed spatially with respect to the surrounding bedrock walls. A typical measurement network is shown in Figure 2. Each measurement network covers a glacier’s entire accumulation zone with a reasonably consistent density of measurements. Because all of the sites are accessed by backpacking, it has not been a problem to reach each glacier at the right date.
Mass balance measurements are in water equivalent. The product of the accumulation layer thickness and density of the snow pack (0.60 g cm-3) yields the water equivalent. Errors in depth measurement are less than +0.05 m, and +0.02-0.03 g cm-3 is the error due to density variation. The resulting error in annual assessment for the accumulation zone ranges from +0.10 to +0.15 m.
Below the snowline ablation stakes emplaced in a triangular pattern are used to determine annual ablation. An ablation triangle consists of three stakes driven or drilled into the ice at 3 m spacing forming an equilateral triangle. Three to four triangles are emplaced on each glacier. Ablation stakes are white wooden poles 3.3 m long. This length was chosen as longer stakes are too cumbersome to transport and emplace, and shorter stakes tend to melt out. Ablation measurements are made at nine points on the triangle periphery from a cross bar resting upon two of the ablation stakes to the firn or ice surface. Measurements are made in late July and early August, recording the ablation during the first three months of the ablation season. After redrilling if necessary in August, ablation measurements are repeated in late September at the designated conclusion of the hydrologic year.
Ablation triangles are placed in a sequence from regions that first lose their snow cover to regions where snow cover perists for a significant portion of the ablation season. Each ablation triangle is then representative of ablation for other portions of the glacier that lose their snowpack simultaneously. Ablation variation over the entire ablation season at the different points on the periphery of a single ablation triangle are insignificant. Thus, individual ablation stakes will be used in future years. If a stake melts out it is not utilized in assessing ablation. Stake meltout has been infrequent, two stakes melted out in 1987 on Lower Curtis Glacier and in 1992 on Rainbow Glacier.
The error in annual ablation measurements is estimated at +0.25 m, due to ice density variations, low sampling density, and stake settling. This estimate is based on the standard deviation in ablation along 50 m long transects with ablation stakes placed 5 m apart. Two of these transects were emplaced on the Columbia Glacier in 1987 and on Rainbow Glacier in 1991. There are at least three ablation measurement sites on each glacier. The sampling density is low at 6-20 points km-2, but comparable to the mean density of 3-17 points km-2 used by the USGS and NVE Table 1.
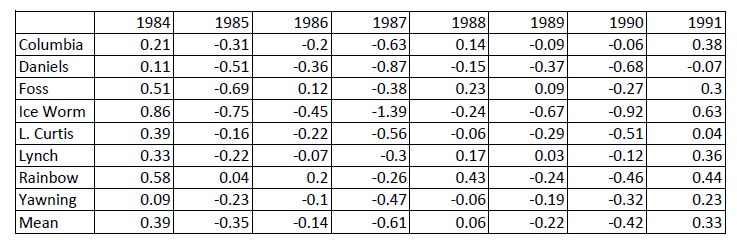
A mass balance map for the entire glacier is then compiled for each glacier. The mass balance for the entire glacier is calculated by summation of the product of glacier area within each 0.10 m mass balance contour, and the net balance of that interval. The error in mass balance calculation for the entire glacier is +0.17 to 0.22 m. The annual balance from l984-l993 for the nine North Cascade glaciers, and in 1994 for eight glaciers is shown in Table 2. Spider Glacier will no longer be monitored, it could not be reached in 1994 because of forest fires in the watershed. The mean annual balance of -0.38 m a-1 for the eight glaciers during the 1984-1994 period is a mean loss of 3.5-5.0 m of glacier thickness during the last 11 years. This is a significant amount given the thin nature of North Cascade glaciers estimated to range from 30-60 m (Post et al., 1971).
Cross Correlation of Net Annual Balance
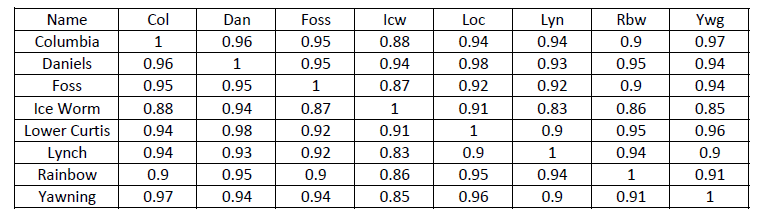
Table 3 contains the cross correlation of annual balance for the eight North Cascade glaciers. The high cross correlations (0.83-0.97) indicate the similarity of each glacier’s annual balance response to the annual climate conditions. Figure 3 displays the annual balance of the eight North Cascade glaciers observed by NCGCP from 1984-1994. The trend from year to year is quite consistent illustrating the high cross correlations. The actual range in annual balance between the glaciers for any given year is significant (Figure 3).
The individual glaciers were selected to represent a range of geographic and topographic characterists. Geographic characteristics of each glacier are in Table 4.
The moderate range of variation in annual balance makes distinguishing which geogrpahic characteristics are most important in determining climate sensitivity difficult. This tendency for small alpine glaciers in the Pacific Northwest to have different mass balance histories, yet high cross correlation coefficients was previously noted by Letreguilly (1989). Letreguilly (1989) compared the mean annual balance histories from 1956-1985 of Blue Glacier, Olympic Mt. (+0.35 m a-1) and South Cascade Glacier, North Cascades (-0.45 m a-1), which were very different. However, their sensivity to specific climate conditions as indicated by a cross correlation coefficient of 0.69 was quite high for two glaciers in different, though adjacent, mountain ranges.
Pelto (1988) in examining the first several years of mass balance data postulated that the variation in annual balance between glaciers is due to their different geographic characteristics. The high cross correlation of annual balance for each glacier suggests that the geographic characteristics are of secondary importance to actual climate conditions, but does not suggest that geographic characteristics are unimportant. The mean annual balance differences between glaciers do reflect important differences that are probably the result of changing geographic characteristics. The annual balance record is insufficient to fully assess this hypothesis yet.
Net Annual Balance Climate Correlation
A comparison of the long term and short term mean for monthly precipitation and temperature from the eight NOAA State of Washington Division 5 Weather Stations (Cascade Mountains) illustrates three important climate changes in the North Cascades for the 1984-1994 period. 1) Mean ablation season temperature has been 1.1oC above the long term mean (1950-1980). 2) That winter precipitation has been 11% below the long term mean. 3) Mean April-June temperature has been 1.3oC above the long term mean. All three of these changes lead to more negative balances, and have been the cause of the rapid glacial retreat that has occurred in the North Cascades during the last 5-7 years (Pelto, 1993).
The four primary climatic variables affecting North Cascade glaciers are ablation season temperature, accumulation season precipitation, summer cloud cover and May and October freezing levels (Tangborn, 1980; Pelto, 1988). Since summer cloud cover is not monitored in the North Cascade region this parameter cannot be examined. Porter (1977) and Tangborn (1980) demonstrated that summer cloud cover is highly correlated with summer temperature, and is inherently included in the temperature record, and is not an independent variable. Freezing level elevations are incorporated by including only May and October precipitation occuring when Stevens Pass temperature is below 7oC as accumulation season precipitation.
Comparison between net annual balance for each glacier, and accumulation season and ablation season conditions at NOAA Washington State Division 5 weather stations is presented in Table 5. Four different measurement methods of accumulation season precipitation (ppt.) are used 1) October-March ppt., 2) October-April ppt. 3) November-March ppt., 4) All ppt. from October-May that falls when the temperature at Stevens Pass is below 7oC. Precipitation data used is the monthly mean for Division 5 weather stations. Weather records from 11 individual weather station were also correlated with annual balance, but each yielded lower correlation coefficients than the Cascade Mountain Division record, probably due to the significant local changes in precipitation for many storm events.
The highest correlation coeffiencts were for measurement method 4 (All ppt. from October-May that falls when the temperature at Stevens Pass is below 7oC) ranging from 0.36-0.59. Only on Yawning Glacier was another method as accurate, method 1 (October-March ppt.) with an identical correlation coefficient. This demonstrates the robustness of method 4.
During the ablation season four climate variables were used 1) May-August mean temperature, 2) May-September mean temperature, 3) June-August mean temperature, 4) June-September mean temperature. Temperatures used were monthly means from Division 5 weather stations. Method 1 (May-August mean temperature) proved to be the most accurate with correlation coefficiets ranging from 0.63-0.84. This was true on all but Lynch Glacier and Rainbow Glacier. Lynch Glacier and Rainbow Glacier have the least negative mean annual balance and highest mean accumulation zone altitude of the eight glaciers. These two glaciers were more closely related to June-September temperature. Except for Lynch and Rainbow Glacier, method 1 yielded correlation coefficients between 0.75 and 0.84.
The correlation between annual net balance is higher for ablation season temperature than for accumulation season precipitation. This does not demonstrate that the glaciers are more sensitive to ablation season conditions. It is more likely a result of temperature being a better measure of ablation than precipitation of actual accumulation.
Conclusion
The annual balance of North Cascade glaciers between 1984 and 1994 has been moderately negative -0.38 m a-1 .
Crevassing on all 9 glaciers where annual balance measurements have been made, has also diminished significantly. A loss of 4.2 meters of ice thickness on glaciers with an estimated mean thickness of 30-50 meters (Post et al., 1971) is significant.
The result of negative annual balance has been glacier retreat. In 1985 of the 47 glaciers we observed, 38 were retreating. In 1994, 46 of 47 glaciers observed were retreating (Pelto, 1993). Lewis Glacier with an area of 0.09 km2 was initially selected for annual mass balance measurements. After completing measurements from 1984-1988, Lewis Glacier melted away in 1989 and 1990, leaving relict ice with an area of 0.03 km2 by the end of 1990. In 1992, David Glacier near Glacier Peak ceased to exist. In 1993, Milk Lake Glacier disappeared. Each of these three glaciers has low winter accumulation. Glaciers with geographic factors increasing mean net annual accumulation have had less negative annual balances and slower glacier retreat rates (Pelto, 1993). During the 1984-1994 period glacier retreat rates have increased substantially due to negative annual balances(Pelto, 1993). The high negative annual balance of recent years combined with the small size of the glaciers will ensure a continued retreat for the next several years.
Acknowledgements
This project has received essential support from the Foundation for Glacier and Environmental Research. The manuscript was greatly improved by Katherine Reed, Washington, Division of Geology and Earth Resources, Doug MacAyeal and two anonymous reviewers. Field assistants have been Kalman Barcsay, Zolt Barcsay, John Brownlee, Richard Campbell, Mike Carver, Joe Drumheller, Ann Fitzpatrick, Monica Gowan, Joel Harper, Cliff Hedlund, Mike Hylland, Dan Kaplinski, David Klinger, David Knoll, Bill Long, John Maggiore, Clifton Mitchell, Bill Prater, Don Sayegh, Lee Scheper and Jill Turner.
Appendix
| Col | Dan | Foss | IW | LC | Lyn | Rain | Yawn | East | NC | SL | Sand | NK | SC | |
| Columbia | 1 | |||||||||||||
| Daniels | 0.83 | 1 | ||||||||||||
| Foss | 0.91 | 0.94 | 1 | |||||||||||
| Ice Worm | 0.89 | 0.94 | 0.91 | 1 | ||||||||||
| Lower Curtis | 0.93 | 0.92 | 0.94 | 0.92 | 1 | |||||||||
| Lynch | 0.86 | 0.96 | 0.98 | 0.9 | 0.93 | 1 | ||||||||
| Rainbow | 0.95 | 0.9 | 0.94 | 0.9 | 0.97 | 0.93 | 1 | |||||||
| Yawning | 0.91 | 0.95 | 0.97 | 0.89 | 0.96 | 0.98 | 0.96 | 1 | ||||||
| Easton | 0.93 | 0.96 | 0.97 | 0.96 | 0.95 | 0.97 | 0.99 | 0.98 | 1 | |||||
| Noisy Creek | 0.83 | 0.87 | 0.84 | 0.89 | 0.85 | 0.85 | 0.85 | 0.87 | 0.93 | 1 | ||||
| Silver Lake | 0.93 | 0.9 | 0.94 | 0.94 | 0.91 | 0.89 | 0.97 | 0.93 | 0.96 | 0.88 | 1 | |||
| Sandalee | 0.87 | 0.95 | 0.97 | 0.92 | 0.9 | 0.96 | 0.95 | 0.97 | 0.97 | 0.94 | 0.96 | 1 | ||
| North Klawatti | 0.9 | 0.8 | 0.85 | 0.88 | 0.82 | 0.8 | 0.92 | 0.84 | 0.9 | 0.8 | 0.98 | 0.9 | 1 | |
| South Cascade | 0.89 | 0.81 | 0.83 | 0.86 | 0.81 | 0.79 | 0.9 | 0.84 | 0.9 | 0.85 | 0.94 | 0.9 | 0.95 | 1 |
Table 3. Cross Correlation of annual balance on North Cascade Glaciers
References
Aellen, M. 1988. Les Variations des Glaciers Suisses 1979/1980 et 1980/81. Publication de la Commission desglaciers, Zurich, 144 p.
Armstrong, R.A. 1989. Mass balance history of the Blue Glacier, Washington. In, Oerlemans, J. GlacierFluctuations and Climate Change. Kluwerc Academic, London, 193-203.
Ebbesmeyer, C.C., D.R. Cayan., D.R. McLain, F.H. Nichols,D.H. Peterson and K.T. Redmond. 1991. 1976 Step inthe Pacific Climate: Forty environmental changes between 1968-175 and 1977-1984. In, Betancourt, J.L. and
V.L. Tharp. Proceedings of the Seventh Annual PacificClimate Workshop. California Dept. of Water Resources,Tech Report no. 26, 129-141.
Heusser, C.J. and M.G. Marcus. 1964. Surface movement, hydrological change and equilibrium flow of Lemon CreekGlacier, Alaska, J. Glaciol., 5(37), 61-75.
Hubley, R. C. 1956. Glaciers of the Washington Cascade and Olympic Mountains; their present activity and itsrelation to local climatic trends. J. Glaciol.,2, 669-74.
Krimmel, R.M., 1989. Mass balance and volume of South Cascade Glacier, Washington 1958-1985. In, Oerlemans,J., Glacier Fluctuations and Climate Change. Kluwer Academic, London, 203-215.
LaChapelle, E.R., 1965. The mass budget of Blue Glacier,Washington. J. Glaciol., 4(33), 252-263.
Letreguilly, A. and L. Reynaud L. 1989. Spatial patterns of mass balance fluctuations of North American glaciers.J. of Glaciol., 35(120), 163-168.
Mayo, L.R., M.F. Meier and W.V. Tangborn. 1972. A system to combine stratigraphic and annual mass-balance systems; A contibution to the IHD. J. Glaciol., 11(61), 3-14.
Meier, M.F. and W.V. Tangborn. 1965. Net budget and flow of South Cascade Glacier, Washington. J. Glaciol.,5(41), 547-566.
Meier, M.F., W.V. Tangborn, L.R. Mayo and A. Post. 1971. Ice and Water balance at selected glaciers in the UnitedStates. Combined ice and water balances of Gulkana and Wolverine Glacier Alaska and South Cascade Glacier,Washington, 1965 and 1966 hydrologic years. US Geological Survey Prof. Paper 715A.
Pelto, M.S., 1988. Annual balance of North Cascade glaciers, Washington, measured and predicted using an activity-index method. J. of Glaciol., 34, 194-200.
Pelto, M.S. 1993. Current behavior of glaciers in the North Cascades and effect on regional water supplies.Washington Geology, 21(2), 3-10.
Porter, S.C. 1977. Present and past glaciation threshold in the Cascade Range, Washington U.S.A.: topographicand climatic controls and paleoclimatic implications. J. Glaciol. 18, 101-116.
Post, A., D. Richardson, W.V. Tangborn and F.L. Rosselot. 1971. Inventory of glaciers in the North Cascades,Washington. US Geological Survey Prof. Paper, 705-A.
Pytte, R. 1969. Glacio-Hydrologiske Undersokelser i Norge 1968. Norges Vassdrages-og Elektrisitsvesen, Rapportnr. 69-1.
Pytte, R. 1975. Glacio-Hydrologiske Undersokelser i Norge 1974. Norges Vassdrages-og Elektrisitsvesen, Rapportnr. 75-1.
Tangborn, W. V. 1980. Two models for estimating climate- glacier relationships in the North Cascades, Washington,U.S.A. J. Glaciol., 25(91): 3-21.