Spatial Variation of Accumulation on Glaciers and Alpine Areas, North Cascades, Washington

Abstract

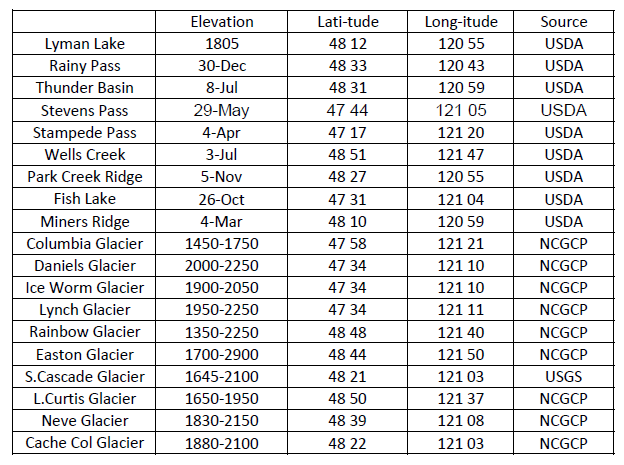
In the North Cascade Range, Washington snowpack accumulation and the resultant ablation provides critical summer water resources. Utilizing SWE data from 10 USDA Snotel sites and 13 glaciers in the North Cascades the variation in maximum SWE accumulation with location are analyzed.  There is strong correlation between precipitation as measured at Diablo Dam and maximum SWE accumulation at each Snotel site, with the strongest correlation being the highest elevation sites.  Cross-correlation of maximum SWE between sites is only strong for sites in the same elevation range.   Maximum SWE at the glacier locations is 299% and 212% of that at the low elevation and high elevation Snotel sites respectively.  

The regional nature of accumulation-Diablo Dam precipitation relationships indicates that neither is particularly dependent on microclimates.   It further suggests that once ground truth data is available for a limited duration for a site, maximum SWE could be determined from climate data.

Introduction

The spatial and temporal variation of snowpack accumulation, snowpack ablation and consequent alpine runoff is crucial to determining regional summer water resources in the North Cascades Range, Washington.  Glaciers alone provide 750 million m3 of runoff each summer (Fountain and Tangborn, 1985).  What is the spatial and temporal variability of accumulation and ablation across the North Cascades?  Rasmussen and Tangborn (1976) noted a poor relationship between observed annual precipitation and annual runoff.  They also noted, in plotting mean annual runoff versus basin mean altitude in 36 basins in the North Cascades, that there was a poor relation between runoff and basin altitude.    

These observations demonstrate that precipitation variation is complex and significant in the region and that extrapolations cannot be made from a standard measurement site to a secondary location based simply on elevation change.  That further extrapolations could not be made from site to site with the available datq.  This paper examines whether maximum winter season snowpack, and snowpack and glacier ablation, can be determined for secondary locations from standard locations once baseline data exists for the secondary sites. 

Data Sets

The following data sets are used (Table 1 and Figure 1): 1) Annual glacier mass balance measurements from thirteen North Cascade glaciers (NCGCP on 8; USGS on 1 and NPS on 4). 2) 3) Daily snow water equivalent and temperature data from 10 USDA Snotel sites, and three snow course sites.

The Natural Resources Conservation Service (NRCS) of the US Department of Agriculture (USDA) operates an extensive automated Snotel system to collect snowpack and climatic data in the western United States.  Snotel sites have at a minimum a pressure sensing snow pillow, storage precipitation gage and air temperature sensor.  The snow pillows are envelopes of stainless steel or synthetic rubber containing an antifreeze solution.  As snow accumulates on the pillow it exerts a pressure that is measured and converted to a reading of snow water equivalent and telemetered to two NRCS master stations.  Each site measures snow water equivalent (SWE) maximum, minimum and average daily temperature (Figure 1).   

From 1000-1900 m the USDA Snotel network provides an excellent network of snowpack and temperature data recorders in the North Cascades, but no sites are found on or adjacent to the highest accumulation areas, which are glaciers.   The necessity of using Snotel sites and glaciers to adequately identify snowpack water resources in the North Cascades is emphasized by the difference in mean maximum winter accumulation in SWE from 1.17 m at the ten USDA Snotel sites, ranging in altitude from 1000-1900 m, and 2.93m at nine glacier locations ranging from 1650-2200 m.  By July 15 the nine glacier locations still average 1.3 m SWE, while the Snotel sites have no snowpack remaining.  Thus, Snotel sites provide a good indicator of late spring and early summer runoff and glaciers a better measure of mid and late summer runoff.

Figure 1. Shows the similar annual pattern of SWE at USDA North Cascade snowpack sites.

Mass balance measurements have been made using the same methods at the same time of the year on nine North Cascade glaciers by NCGCP (Pelto, 1996; and Pelto and Riedel, 2001).  The USGS has maintained a mass balance record and weather records at South Cascade Glacier since 1958 (Krimmel,1993-1999).  The North Cascades National Park Service began measuring mass balance on four glacier in 1993 (Pelto and Riedel, 2001). Each program monitors ablation during specific time periods using stakes emplaced in the glacier surface.  Revisiting each site through the ablation season and measuring the emergence of each stake identifies the ablation rate.  The maximum snowpack depth and water equivalent is also determined at specific locations at approximately the same time each year in early to mid-May utilizing probes driven through the snowpack on the glacier. 

Table 1. Location of USDA snotel, USGS and NCGCP glacier
Table 2. The date of maximum SWE accumulation at five USDA Snotel sites in Washington.

Maximum Snowpack Accumulation

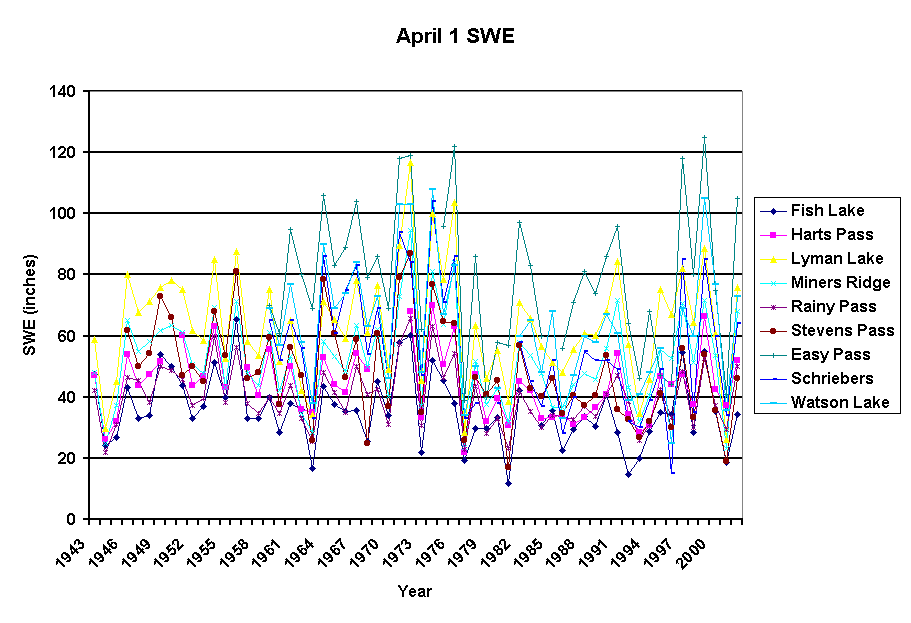
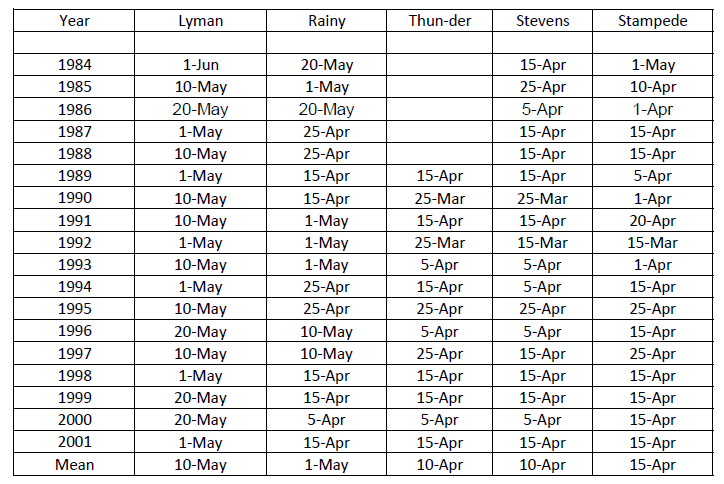
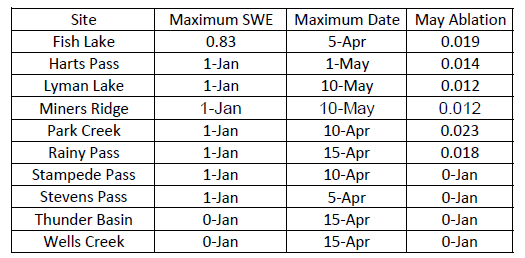
At the ten Snotel sites from November 1-February 15 snowpack development is rapid reaching 68-80% of the maximum (SWE).  The average maximum SWE for sites above 1500 m is May 5, and for sites below 1500 m is April 10 (Table 2).  The actual maximum accumulation varies with elevation ranging from 0.8 m to 1.6 m, with a mean of 0.98 m for the six sites below 1500 m and a mean of 1.38 m above 1500 m (Figure 2).  The maximum glacier snowpack SWE is distinctly larger with an average accumulation of 2.93 m.

The correlation of daily SWE for the 1989-1997 period at the four Snotel sites between 1500 m and 1900 m ranges from 0.88-0.99.   From 1000 to 1500m the daily SWE correlation coefficient at eight Snotel sites is 0.87-0.99.  The correlation between the high elevation and low elevation Snotel sites is 0.63-0.96.    Each elevation band is then a good predictor of SWE only at the sites in the same elevation band.  The correlation between annual maximum snowpack and total winter precipitation at Diablo Dam is highest for Snotel sites above 1500 m (0.75-0.81). For sites below 1500 m the correlation drops to  (0.63-0.75).   This is expected since a higher proportion of total precipitation falls as snow at the higher sites.

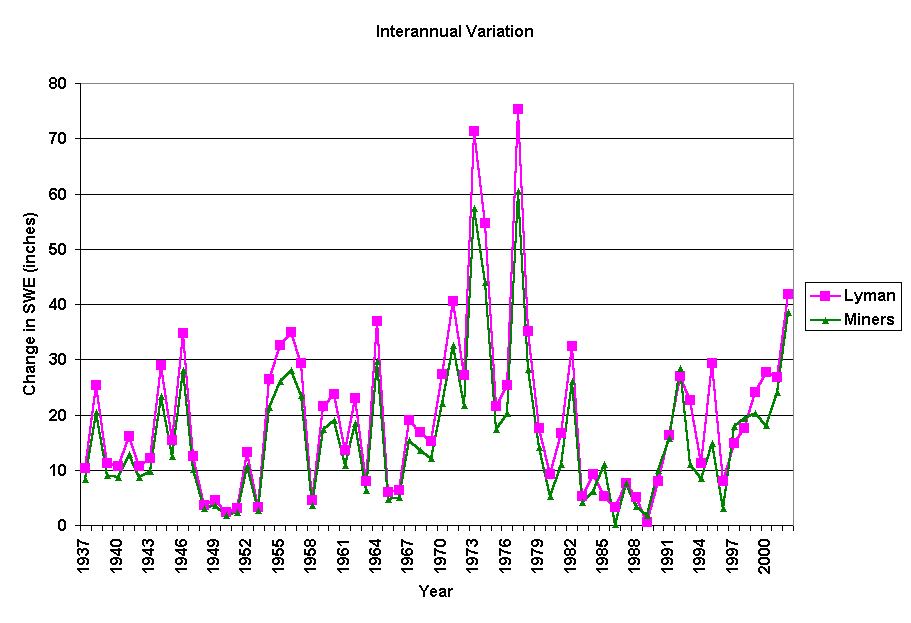
Comparison of annual maximum SWE on glaciers yields cross correlations of 0.82-0.99, indicating the strong regional control of accumulation.  The mean correlation between low elevation sites and glacier maximum SWE ranges from 0.37-0.82 and for Lyman Lake the best Snotel site from 0.72-0.95.  The two best sites for prediction of glacier snowpack are Lyman Lake and North Klawatti Glacier.

 The mean and maximum SWE depth is variable from site to site, however, the annual pattern of development and relative amount is consistent in response to specific annual climate conditions for each elevation band. 

Table 3. The average maximum SWE,, average date of maximum SWE, and mean daily ablation in May at Snotel sites.

Inter-annual Variability

Accumulation variations since 1950 are shown for Miners Ridge and Lyman Lake the consistency is evident between the two sites (figure 4).  It is also clear that two periods of exceptional variability exist one from 1964-1976 and one from 1996-present.  The former period had a higher consistent average.  By contrast the 1980’s had limited variation.  A measure of variability is the absolute value of the change from the mean of the previous year (figure 4).  The Pacific Decadal Oscillation  (PDO) is a long term atmospheric circulation that is important to the Pacific Northwest.  The PDO is a long-lived El Niño-like pattern of Pacific climate variability. Two main characteristics distinguish PDO from El Niño/Southern Oscillation (ENSO): first, 20th century PDO “events” persisted for 20-to-30 years, while typical ENSO events persisted for 6 to 18 months; second, the climatic fingerprints of the PDO are most visible in the North Pacific/North American sector. Several independent studies find evidence for just two full PDO cycles in the past century: “cool” PDO regimes prevailed from 1890-1924 and again from 1947-1976, while “warm” PDO regimes dominated from 1925-1946 and from 1977 through (at least) the mid-1990’s.  Since the mid 1990’s the PDO has not established a new warm or cold regime, the result large variations in accumulation. 

Figure 3. The variation of snowpack with time at five Snotel Sites. Regardless of start date substantial declines are evident in the long terms series, more than 30 years, from 1980-present there is not a decline.
Figure 4. The absolute value of annual change in accumulation versus the previous year.

Conclusions

Accumulation is widely variable and can only be estimated if baseline data is available.  Data from Lyman Lake and Diablo Dam provide the best overall correlation for maximum SWE.  Local climate in the North Cascades influences mean snowpack depth, but does not cause significantly different responses to annual climate conditions within specific elevation bands.   Extrapolation from site to site for accumulation can be accomplished, but only when the sites are at similar elevations and the sites have a baseline history documenting the specific development of snowpack.

To model or directly calculate the timing and magnitude of water resource storage it is essential to collect baseline data on accumulation at numerous secondary sites.  Once the relationship of these secondary sites can be related to long-term records at primary measurement sites, then the secondary sites measurements can be discontinued.  This also applies to early season, April-May ablation.   It is also evident that the Snotel system provides an excellent and cost effective means of collecting data on snowpack development from 1000-1900 m in the North Cascades, but does not well represent snowpack accumulation at the average glacier accumulation zones of 2000 m.  Making accurate summer streamflow estimates is impossible without data from glacier sites.

References

Fountain, A and Tangborn, W.V. 1985. ‘The effect of glaciers on  streamflow variations’.  Water Res. Res., 21, 579-586.

Krimmel, R.M.  1993.  ‘Mass balance, meteorologic, and runoff measurements at South Cascade Glacier, Washington, 1992 balance year’. USGS OFR-93-640.

Krimmel, R.M.  1994.  ‘Runoff, Precipitation, mass balance, and ice velocity measurements at South Cascade Glacier, Washington, 1993 balance year’.   USGS  OFR-94-4139.

Krimmel, R.M.  1995.  ‘Water, ice and meteorological measurements at South Cascade Glacier, Washington, 1994 balance year’.  USGS OFR-95-4162.

Krimmel, R.M.  1996.  ‘Water, ice and meteorological measurements at South  Cascade Glacier, Washington, 1995 balance year’.  USGS OFR-96-4174.

Krimmel, R.M.  1997.  ‘Water, ice and meteorological measurements at South Cascade Glacier, Washington, 1996 balance year’.  USGS OFR-97-4143.

Letreguilly, A. and Reynaud. L. 1989.  Spatial patterns of mass balance fluctuations of North American glaciers.  J Glaciol.,  35(120), 163-168.

Pelto, M.S.  1993. ‘Current behavior of glaciers in the North Cascade and effect on regional water supplies’. Washington Geology, 21(2), 3-10.

Pelto, M.S.  1996.  ‘Annual balance of North Cascade glaciers from 1984-1994’. J. of Glaciology, 41, 3-9.

Pelto, M.S. 1996.  ‘Recent changes in glacier and alpine runoff in the North Cascades, Washington’.  Hydrol. Processes, 10, 1173-1180.

Pelto, M.S. and Hedlund, C. 2001.  Terminus behavior and response time of North Cascade glaciers, Washington U.S.A. Journal of Glaciology 47, 497-506.

Pelto, M.S. and Riedel, J. 2001.  Spatial and temporal variations in annual balance of North Cascade glaciers, Washington 1984-2000.  Hydrologic Processes.

Rasmussen. L.A., and Tangborn, W.V. 1976.  ‘Hydrology of the North Cascade Region, Washington 1.  Runoff, Precipitation, and Storage Characteristics’.     Wat. Res. Res., 12(2), 187-202.