Abstract
In the North Cascade Range, Washington snowpack accumulation and the resultant ablation provides critical summer water resources. Utilizing SWE data from 10 USDA Snotel sites and 13 glaciers in the North Cascades the variation in maximum SWE accumulation and ablation rates with location are analyzed. Maximum SWE at the glacier locations is 299% and 212% of that at the low elevation and high elevation Snotel sites.
Ablation has been measured for periods of at least two weeks with on site temperature measurement at numerous Snotel and glacier sites. The resulting relationship is consistent and indicates that on-site temperature provides a good estimate of ablation over a multi-week period regardless of location at a Snotel site or on a glacier. This holds true for snow and for glacier ice, though the relationships are different. Ablation peaks in May at low elevation Snotel sites, in June at high elevation Snotel sites, and in August on glaciers. Glacier dominate runoff from the alpine zones from July-August. This indicates that monitoring of glacier ablation is essential for forecasting of alpine runoff. The regional nature of both the ablation-temperature and accumulation-Diablo Dam precipitation relationships indicates that neither is particularly dependent on microclimates. It further suggests that once ground truth data is available for a limited duration for a site, maximum SWE or ablation could be determined from climate data.
Introduction
The spatial and temporal variation of snowpack accumulation, snowpack ablation and consequent alpine runoff is crucial to determining regional summer water resources in the North Cascades Range, Washington. Glaciers alone provide 750 million m3 of runoff each summer (Fountain and Tangborn, 1985). What is the spatial and temporal variability of accumulation and ablation across the North Cascades? Rasmussen and Tangborn (1976) noted a poor relationship between observed annual precipitation and annual runoff. They also noted, in plotting mean annual runoff versus basin mean altitude in 36 basins in the North Cascades, that there was a poor relation between runoff and basin altitude.
These observations demonstrate that precipitation variation is complex and significant in the region and that extrapolations cannot be made from a standard measurement site to a secondary location based simply on elevation change. That further extrapolations could not be made from site to site with the available datq. This paper examines whether maximum winter season snowpack, and snowpack and glacier ablation, can be determined for secondary locations from standard locations once baseline data exists for the secondary sites.
Data Sets
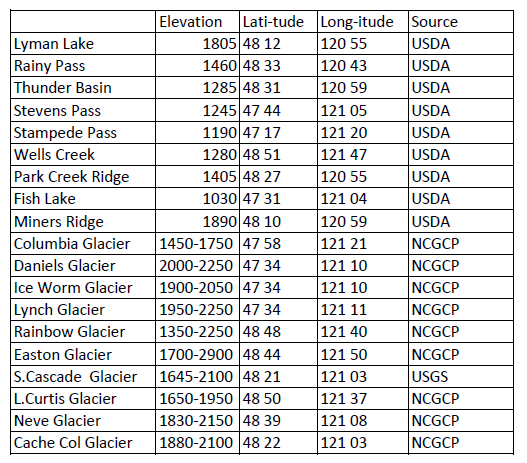
The following data sets are used (Table 1 and Figure 1): 1) Annual glacier mass balance measurements from thirteen North Cascade glaciers (NCGCP on 8; USGS on 1 and NPS on 4). 2) Snowpack ablation from 1984-2002 on four glaciers (3 by NCGCP and 1 by USGS). 3) Daily snow water equivalent and temperature data from 10 USDA Snotel sites.
The Natural Resources Conservation Service (NRCS) of the US Department of Agriculture (USDA) operates an extensive automated Snotel system to collect snowpack and climatic data in the western United States. Snotel sites have at a minimum a pressure sensing snow pillow, storage precipitation gage and air temperature sensor. The snow pillows are envelopes of stainless steel or synthetic rubber containing an antifreeze solution. As snow accumulates on the pillow it exerts a pressure that is measured and converted to a reading of snow water equivalent and telemetered to two NRCS master stations. Each site measures snow water equivalent (SWE) maximum, minimum and average daily temperature (Figure 1).
From 1000-1900 m the USDA Snotel network provides an excellent network of snowpack and temperature data recorders in the North Cascades, but no sites are found on or adjacent to the highest accumulation areas, which are glaciers. The necessity of using Snotel sites and glaciers to adequately identify snowpack water resources in the North Cascades is emphasized by the difference in mean maximum winter accumulation in SWE from 1.17 m at the ten USDA Snotel sites, ranging in altitude from 1000-1900 m, and 2.93m at nine glacier locations ranging from 1650-2200 m. By July 15 the nine glacier locations still average 1.3 m SWE, while the Snotel sites have no snowpack remaining. Thus, Snotel sites provide a good indicator of late spring and early summer runoff and glaciers a better measure of mid and late summer runoff.
Mass balance measurements have been made using the same methods at the same time of the year on nine North Cascade glaciers by NCGCP (Pelto, 1996; and Pelto and Riedel, 2001). The USGS has maintained a mass balance record and weather records at South Cascade Glacier since 1958 (Krimmel,1993-1999). The North Cascades National Park Service began measuring mass balance on four glacier in 1993 (Pelto and Riedel, 2001). Each program monitors ablation during specific time periods using stakes emplaced in the glacier surface. Revisiting each site through the ablation season and measuring the emergence of each stake identifies the ablation rate. The maximum snowpack depth and water equivalent is also determined at specific locations at approximately the same time each year in early to mid-May utilizing probes driven through the snowpack on the glacier.
Snowpack Ablation
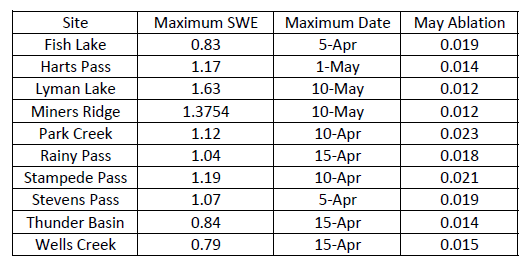
Early in the melt season (April-June 15), ablation is dominated by melt at the lower elevation range (>1500m) in alpine basins (Pelto, 1996; Fountain and Tangborn, 1985). Ablation during May at Snotel sites from 1000-1500 m, averages 0.018 m/day, while at sites from 1500-1900 m average ablation is 0.012m/day, and above 1600 m on glaciers average ablation is 0.08 m/day (Table 3). Snowpack ablation is reduced somewhat for the Snotel sites are that more protected by surrounding forest (Wells Creek and Thunder Basin).
Observations of snowpack loss at Snotel sites in the North Cascades identifies the variations in ablation. The characteristics of sites used are noted in Table 1, Fish Lake, Harts Pass, Lyman Lake, Miners Ridge, Park Creek, Rainy Pass, Stampede Pass, Stevens Pass, Thunder Basin and Wells Creek. Snowpack is lost from the lower Snotel sites, below 1400 m, in May or early June. The early ablation season, is marked by freezing levels that frequently result in snowfall at Lyman Lake and rainfall at the lower elevation Snotel sites. Cross correlation of May monthly ablation rates between Snotel sites as a result is poor, as are the daily ablation rates, correlation coefficients ranging from 0.43-0.76. Correlating ablation at Lyman Lake with precipitation, maximum, minimum and average temperature, indicates the best correlation coefficient for monthly May ablation is with average daily temperature at 0.74. The early season monthly correlation between the high elevation Snotel sites and glacier sites is modest at 0.72.
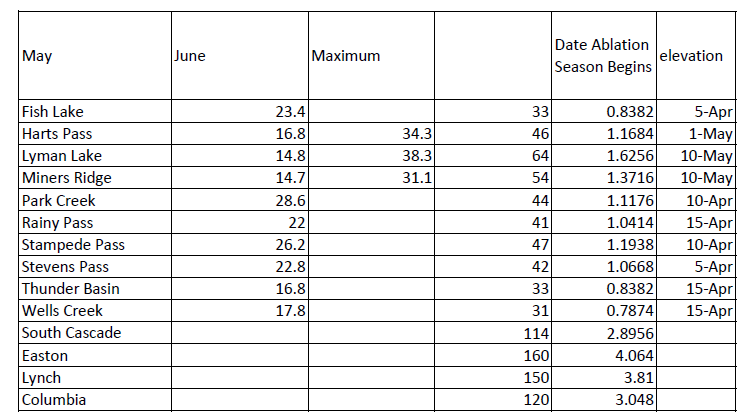
Average ablation after June 1 is limited to data from Snotel sites above 1400 m and glaciers. At the three stations, where snowpack endured throughout all of June, ablation ranged from 0.027 -0.032 m m/day. June ablation on South Cascade, Easton and Columbia Glacier, during these same June periods, ranged from 0.23-0.29 m/day, averaging 0.027 m/day. The correlation from glacier to glacier for the same time periods is 0.86-0.99, indicating that ablation conditions are becoming increasingly consistent on glaciers as the summer melt season develops. Correlation in daily ablation rates for the three Snotel sites is 0.79-0.92 indicating that in the elevation zone from 1500-2000 m across the North Cascades ablation after June 1 has a comparatively low degree of variability. Correlating ablation at Lyman Lake with precipitation, maximum, minimum and average temperature, indicates the best correlation coefficient for June is with maximum daily temperature at 0.85.
By early July snowpack beyond the glacier margins is limited, Snotel sites have lost their snowcover, and yet streamflow is still heavily dependent on snow and ice melt from glaciers (Fountain and Tangborn, 1985; Pelto, 1996). From July-September glaciers are the primary area of residual snow and ice ablation. This region has the highest melt rates during this period, while other inputs are at an annual low (Rasmussen and Tangborn, 1976). Thus, glaciers ameliorate low flow conditions (Fountain and Tangborn, 1985; Pelto, 1993). In heavily glaciated basins such a Baker River from 20-45% of the total input is from glacier melt during the latter part of the summer (Pelto, 1996; Post et al; 1971). This glacier runoff is best determined by direct measurement of ablation on glaciers. NCGCP (Pelto, 1996; Pelto and Riedel, 2001) and the USGS (Krimmel, 1998) measurements on glaciers do provide a direct measure of ablation in this elevation band at multiple locations over the last 20 years. Stakes drilled into the snow and ice of the glacier’s are measured several weeks and or months after emplacement. This provides the ablation rate.
Ablation measurement on nine North Cascade glaciers for twenty-nine discrete two to six week periods during this part of the ablation season yield mean ablation rates of 0.036 m/day, 0.038 m/day and 0.028 m/day for July, August and September respectively. The correlation in mid and late season ablation between each glacier exceeds 0.95 indicating the degree to which the regional summer climate is consistent across the North Cascades.
Comparison of ablation rates and onsite temperature records in the case of the South Cascade Glacier, Easton Glacier, Ice Worm Glacier and Columbia Glacier yield a relationship between air temperature and daily ablation for snow and ice in SWE (Figure 1). Figure 3 also contains data from Lyman Lake, and Stevens Pass. The ablation data-temperature relationships is not statistically different for the Snotel and glacier sites. There is a significant difference between snow and ice ablation for the same temperature (Figure 1).
Conclusions
Accumulation is widely variable and can only be estimated if baseline data is available. Data from Lyman Lake and Diablo Dam provide the best overall correlation for maximum SWE. Ablation rates in May at the start of the melt season are widely variable from site to site, but fit within specific mean ranges based on elevation. Ablation rates after June 1 are similar in the summer season, and can be extrapolated from primary to secondary sites in regions above 1500 m, without substantial baseline data. By mid-summer ablation rates do not vary substantially within the 1600 m-2400 m elevation band, which is the primary elevation zone for glaciers. The most important ramification is that if the distribution and depth of the snowpack is known on June 1, than summer water resources can be estimated for a wide range of basins from a limited number of primary ablation measurement sites.
Local climate in the North Cascades influences mean snowpack depth and ablation rate, but does not cause significantly different responses to annual climate conditions within specific elevation bands. Extrapolation from site to site for accumulation can be accomplished, but only when the sites are at similar elevations and the sites have a baseline history documenting the specific development of snowpack. .
To model or directly calculate the timing and magnitude of water resource storage it is essential to collect baseline data on accumulation at numerous secondary sites. Once the relationship of these secondary sites can be related to long-term records at primary measurement sites, then the secondary sites measurements can be discontinued. This also applies to early season, April-May ablation. Ablation rates and consequent runoff can be assessed from a few primary sites at glaciated levels from June 1-September 31. It is also evident that the Snotel system provides an excellent and cost effective means of collecting data on snowpack development from 1000-1900 m in the North Cascades, but does not well represent snowpack accumulation at the average glacier accumulation zones of 2000 m. Making accurate summer streamflow estimates is impossible without data from glacier sites.
Appendix
References
Fountain, A and Tangborn, W.V. 1985. ‘The effect of glaciers on streamflow variations’. Water Res. Res., 21, 579-586.
Krimmel, R.M. 1993. ‘Mass balance, meteorologic, and runoff measurements at South Cascade Glacier, Washington, 1992 balance year’. USGS OFR-93-640.
Krimmel, R.M. 1994. ‘Runoff, Precipitation, mass balance, and ice velocity measurements at South Cascade Glacier, Washington, 1993 balance year’. USGS OFR-94-4139.
Krimmel, R.M. 1995. ‘Water, ice and meteorological measurements at South Cascade Glacier, Washington, 1994 balance year’. USGS OFR-95-4162.
Krimmel, R.M. 1996. ‘Water, ice and meteorological measurements at South Cascade Glacier, Washington, 1995 balance year’. USGS OFR-96-4174.
Krimmel, R.M. 1997. ‘Water, ice and meteorological measurements at South Cascade Glacier, Washington, 1996 balance year’. USGS OFR-97-4143.
Letreguilly, A. and Reynaud. L. 1989. Spatial patterns of mass balance fluctuations of North American glaciers. J Glaciol., 35(120), 163-168.
Pelto, M.S. 1993. ‘Current behavior of glaciers in the North Cascade and effect on regional water supplies’. Washington Geology, 21(2), 3-10.
Pelto, M.S. 1996. ‘Annual balance of North Cascade glaciers from 1984-1994’. J. of Glaciology, 41, 3-9.
Pelto, M.S. 1996. ‘Recent changes in glacier and alpine runoff in the North Cascades, Washington’. Hydrol. Processes, 10, 1173-1180.
Pelto, M.S. and Hedlund, C. 2001. Terminus behavior and response time of North Cascade glaciers, Washington U.S.A. Journal of Glaciology 47, 497-506.
Pelto, M.S. and Riedel, J. 2001. Spatial and temporal variations in annual balance of North Cascade glaciers, Washington 1984-2000. Hydrologic Processes.
Rasmussen. L.A., and Tangborn, W.V. 1976. ‘Hydrology of the North Cascade Region, Washington 1. Runoff, Precipitation, and Storage Characteristics’. Wat. Res. Res., 12(2), 187-202.